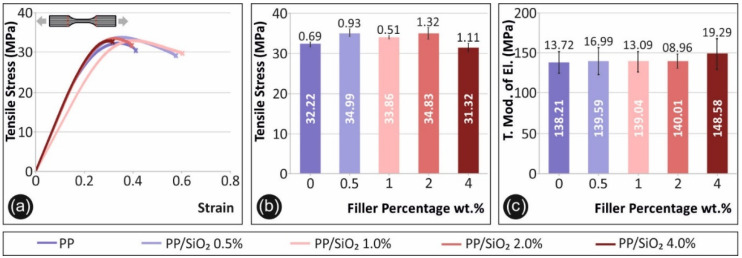
Figure 3.
Tensile test results: (a) tensile stress (MPa) to strain (%) graph, for a characteristic specimen of each material fabricated, (b) average maximum tensile stress (MPa) and its deviation for the materials tested, (c) average tensile modulus of elasticity (MPa) and its deviation for the materials tested.

