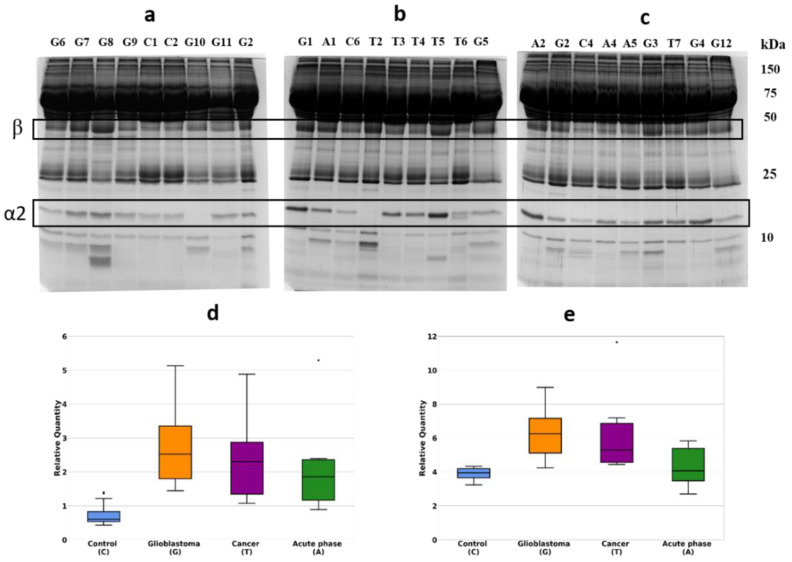
Figure 1.
SDS-PAGE of plasma samples, Coomassie staining. The representative gels stained with Coomassie (a–c). Statistical analysis of the band intensity of α2-chain (d). Statistical analysis of the band intensity of β-chain (e). GBM samples are marked as G, control—as C, cancer—as T, acute phase—as A.

