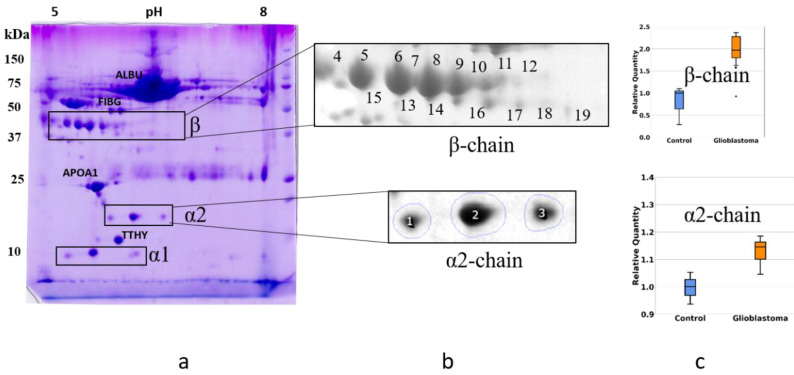
Figure 3.
The comparative 2DE analysis of the abundance of Hp α2- and β-chain proteoforms in plasma of control and GBM patients. A representative Coomassie-stained 2DE gel of plasma proteins (GBM) with identified positions of α- and β-chains (a). The enlarged areas with spots containing α2- and β-chain proteoforms (b). MS data about proteins detected in different spots can be found in the Supplementary Materials Tables. A comparative statistical analysis of sum spot intensities in control and GBM samples (c).

