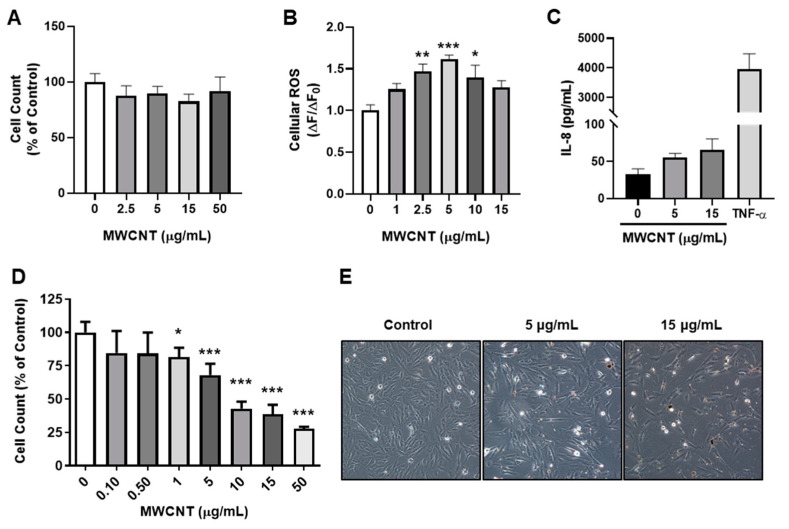
Figure 1.
Cellular responses to MWCNT in BEAS2B. (A) Cytotoxicity was evaluated by total cell counts 24 h post exposure. Cells were rinsed and stained with AO/PI and then counted in a Cellometer 2000 (n = 6). (B) Cellular ROS was determined using DCF-DA 8 h post exposure (n = 6). (C) IL-8 release was assessed by ELISA in MWCNT or TNF-α (10 ng/mL) treated cells 24 h post exposure (n = 3). (D,E) Cell proliferation was assessed by AO/PI staining and light microscopy 48 h post exposure. Data are expressed as mean ± SEM (n ≥ 3). Statistical significance was determined by Tukey’s HSD (one-way ANOVA). * p < 0.05, ** p < 0.01, *** p < 0.001 indicates significance. Equal volumes of DPPC in the highest MWCNT concentration tested was added to 0 µg/mL controls.

