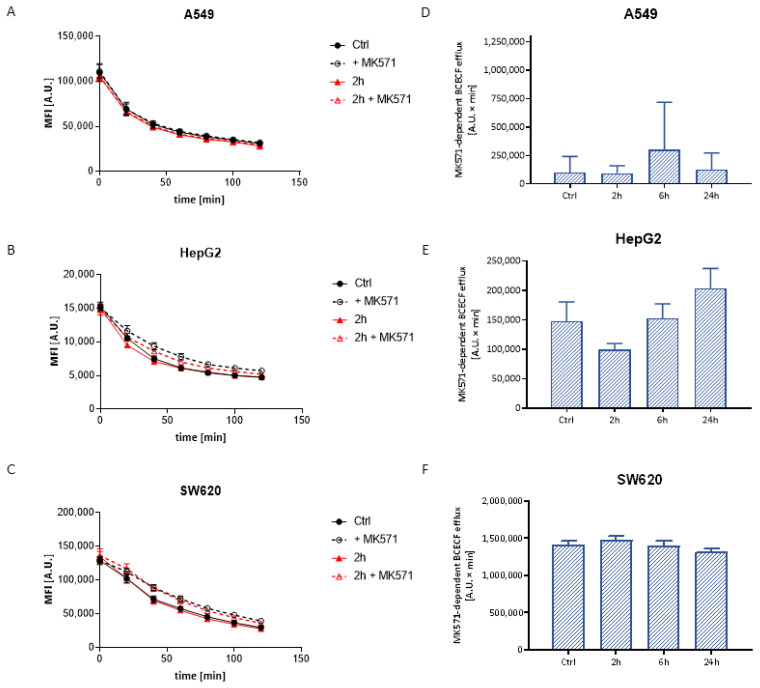
Figure 4.
Illustrative plot of intracellular BCECF efflux versus time in A549 (A), HepG2 (B) and SW620 (C) cells treated with Ag20 in the presence and absence of MK571. MK571-dependent BCECF efflux in A549 (D), HepG2 (E) and SW620 (F) cell lines treated for 2, 6 and 24 h with 50 μg/cm3 Ag20 expressed as the area under the curve of the fluorescence decay over time. One-way ANOVA and Dunnett’s post hoc test were used. Data expressed as arithmetic mean ± SD; n = 3.

