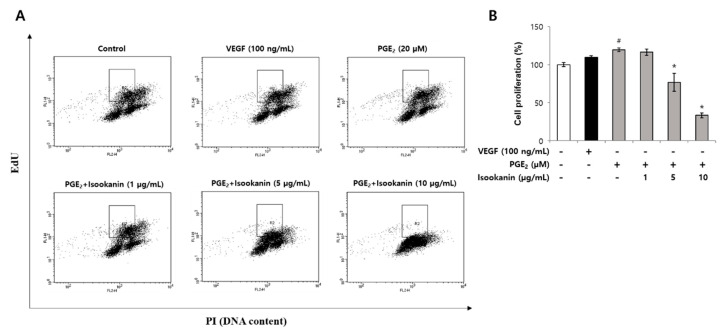
Figure 4.
The anti-proliferative effect of isookanin on PGE2-induced HMEC-1 cells. Cells were pretreated with the indicated concentrations of isookanin for 2 h before stimulation with PGE2 (20 µM) for 24 h. Then, cell proliferation was measured using the Click-iT EdU Cytometry Assay Kit and propidium iodide dual staining to determine cell proliferation. (A) EdU and DNA contents were analyzed by flow cytometry. Bivariate distributions of EdU incorporation (y axis) vs. DNA content (x axis) were plotted. The boxes indicate EdU-incorporated cells in the S-phase. (B) Cell proliferations are expressed as percentages of EdU-labeled S-phase populations to total cell numbers. The results are mean ± standard deviation (SD) (n = 3). # p < 0.05 vs. control. * p < 0.05 vs. PGE2-treated control.

