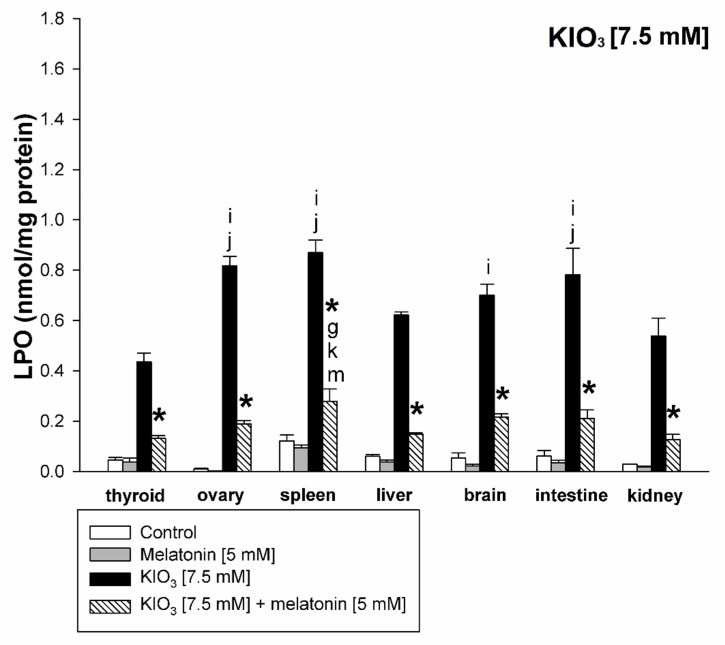
Figure 6.
Lipid peroxidation, measured as MDA + 4-HDA level, in homogenates of porcine tissues (thyroid, ovary, spleen, liver, brain, small intestine, kidney), incubated without any substance (control; white bars), or with melatonin [5 mM] (grey bars), or with KIO3 [7.5 mM] (black bars), or with KIO3 [7.5 mM] + melatonin [5 mM] (striped bars). *—p < 0.05 vs. KIO3 in the same tissue; i—p < 0.05 vs. KIO3 [10 mM] in thyroid; j—p < 0.05 vs. KIO3 [10 mM] in kidney; g—p < 0.05 vs. KIO3 [10 mM] + melatonin [5 mM] in kidney; k—p < 0.05 vs. KIO3 [10 mM] + melatonin [5 mM] in thyroid; m—p < 0.05 vs. KIO3 [10 mM] + melatonin [5 mM] in liver.

