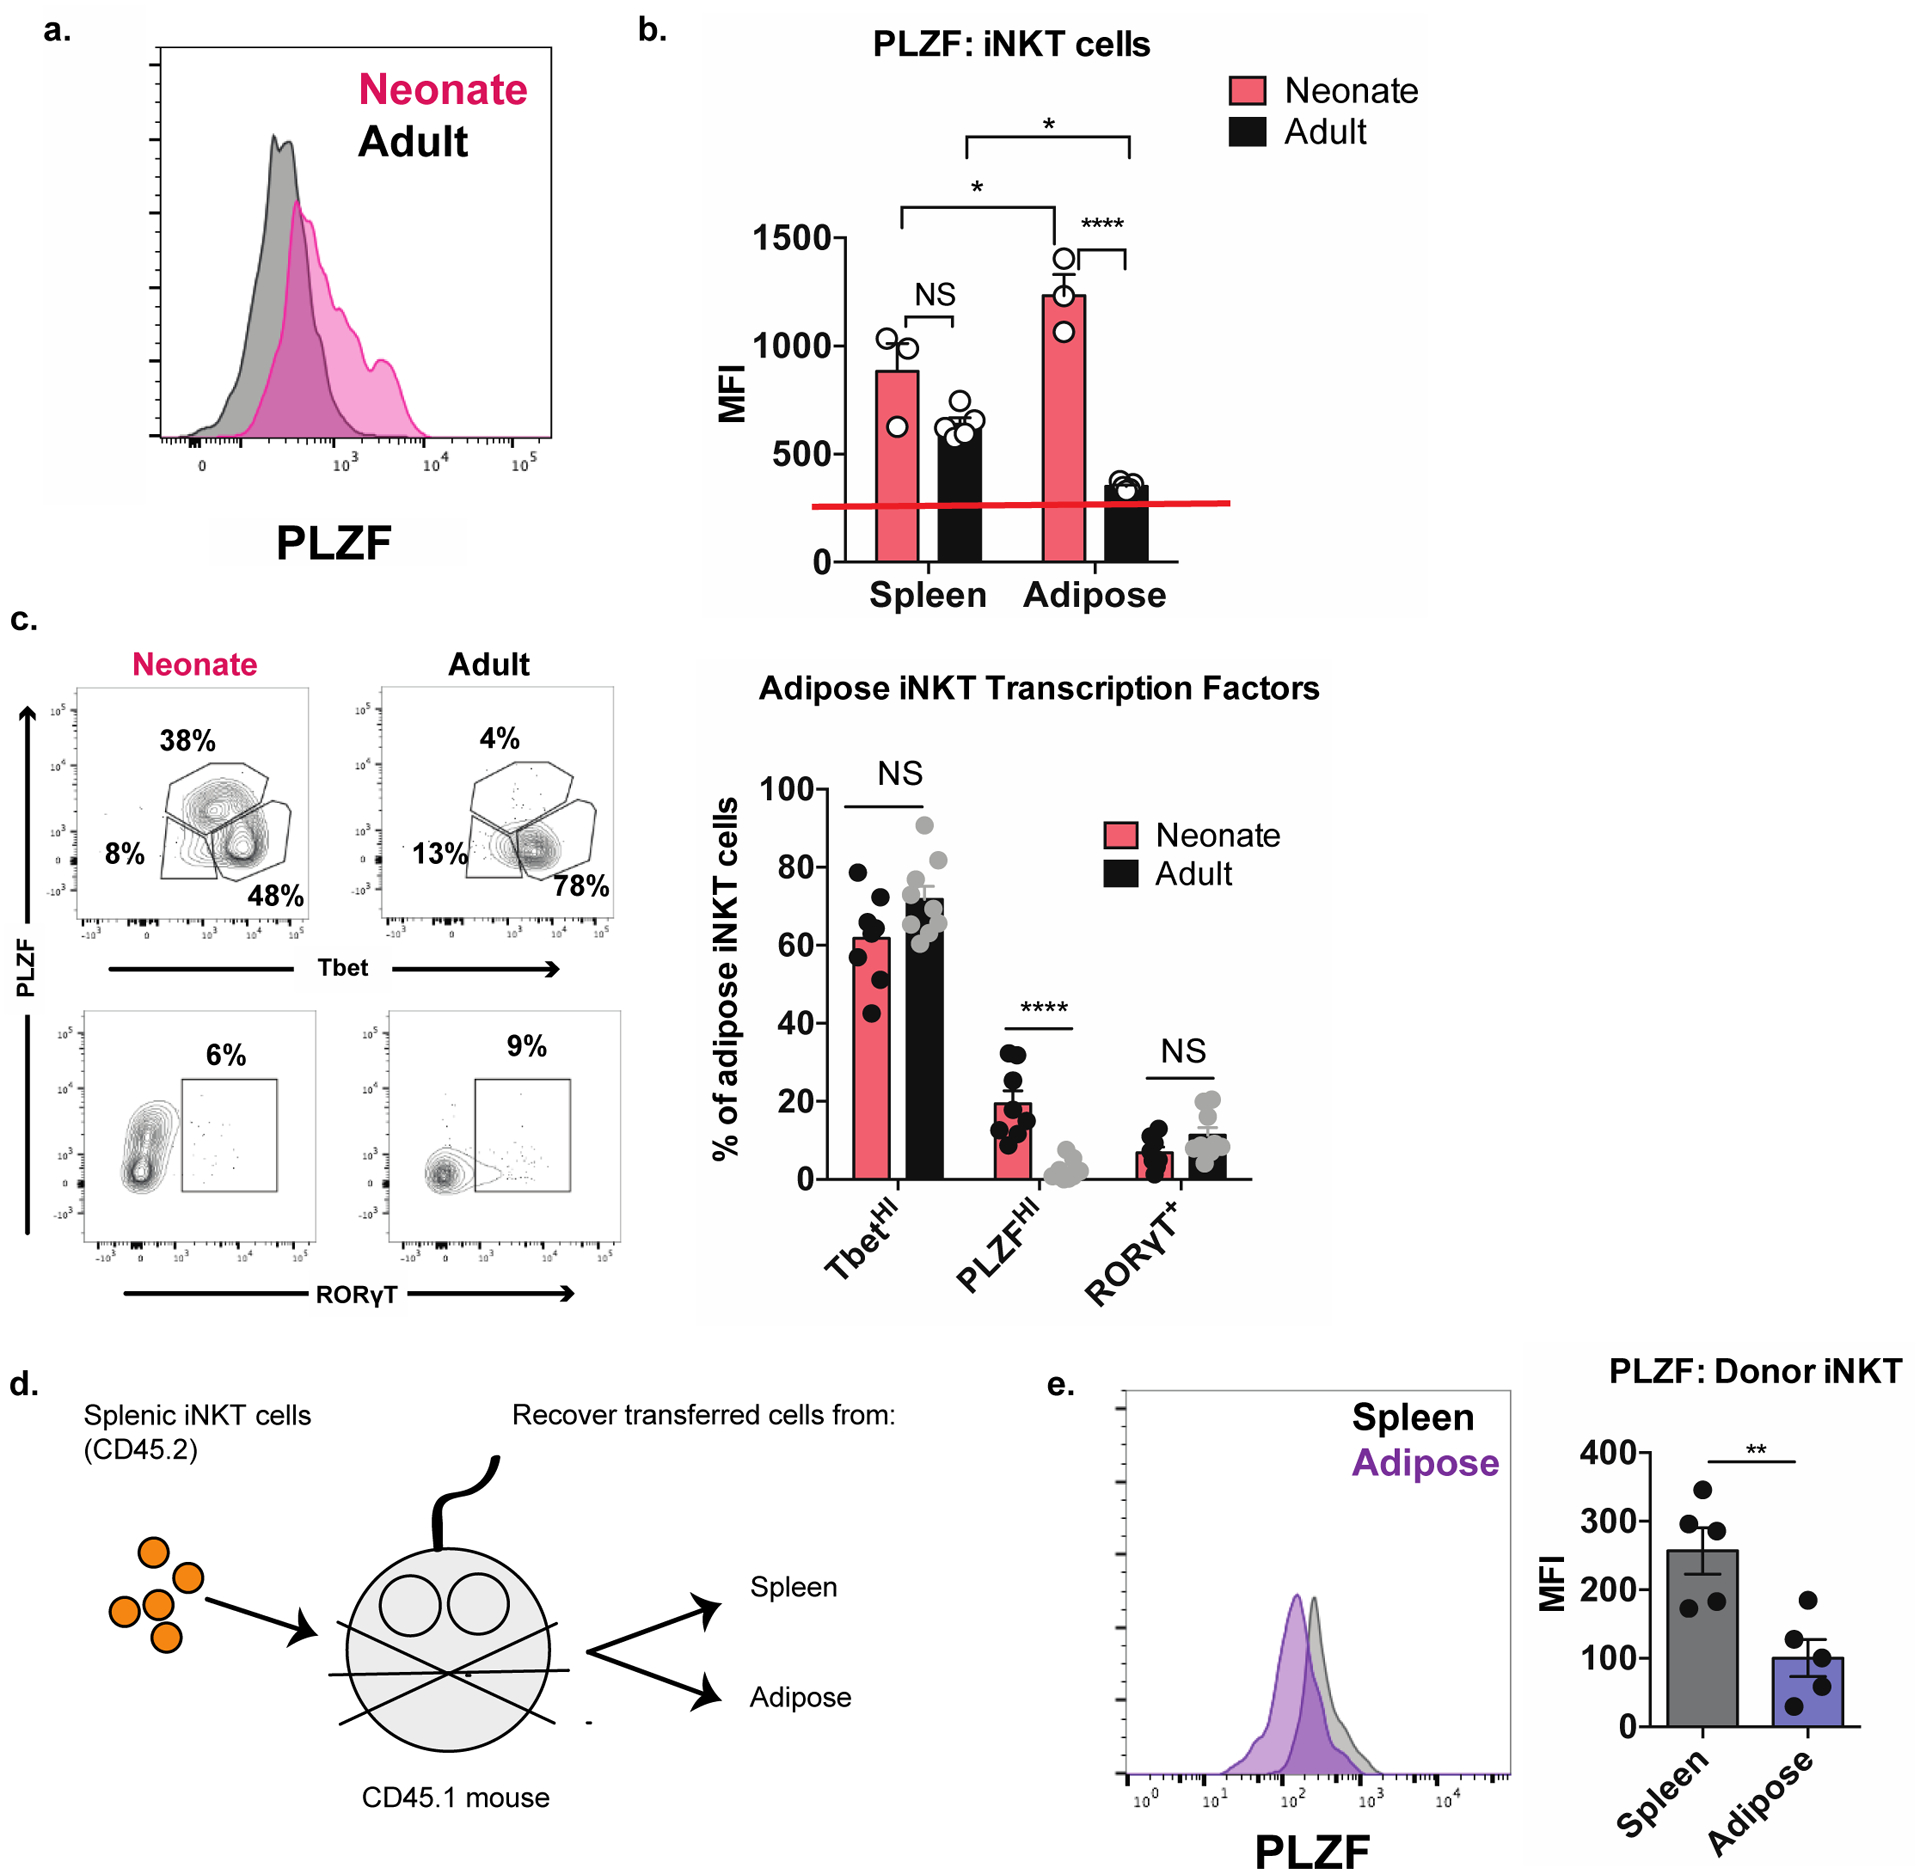
Figure 1. Adipose tissue iNKT cells lose PLZF expression with age.

(a) Representative histogram of PLZF expression in adipose iNKT cells from neonatal and adult mice (n = 3–5 histograms analyzed per group).
(b) Quantification of PLZF expression in splenic and adipose iNKT cells from neonatal and adult mice (n = 3–5 mice or pooled mice per group). Red line indicates the baseline PLZF mean fluorescence intensity of PLZFNEG T cells.
(c) Adipose tissue iNKT cells in neonatal and adult mice were analyzed by biaxial gating of PLZF against either Tbet or RORγT (n = 8 mice).
(d) Schematic diagram outlining adoptive transfer experiment.
(e) Expression of PLZF in transferred splenic iNKT cells recovered from recipient spleen and adipose tissue (n = 5 mice).
NS, not significant (P > 0.05); *P < 0.05; **P < 0.01; ***P < 0.001; ****P < 0.0001. Two-tailed Student’s t-test. Error bars indicate mean (± S.E.M.). Data are representative of three or more independent experiments (a-c) or two experiments (e).
