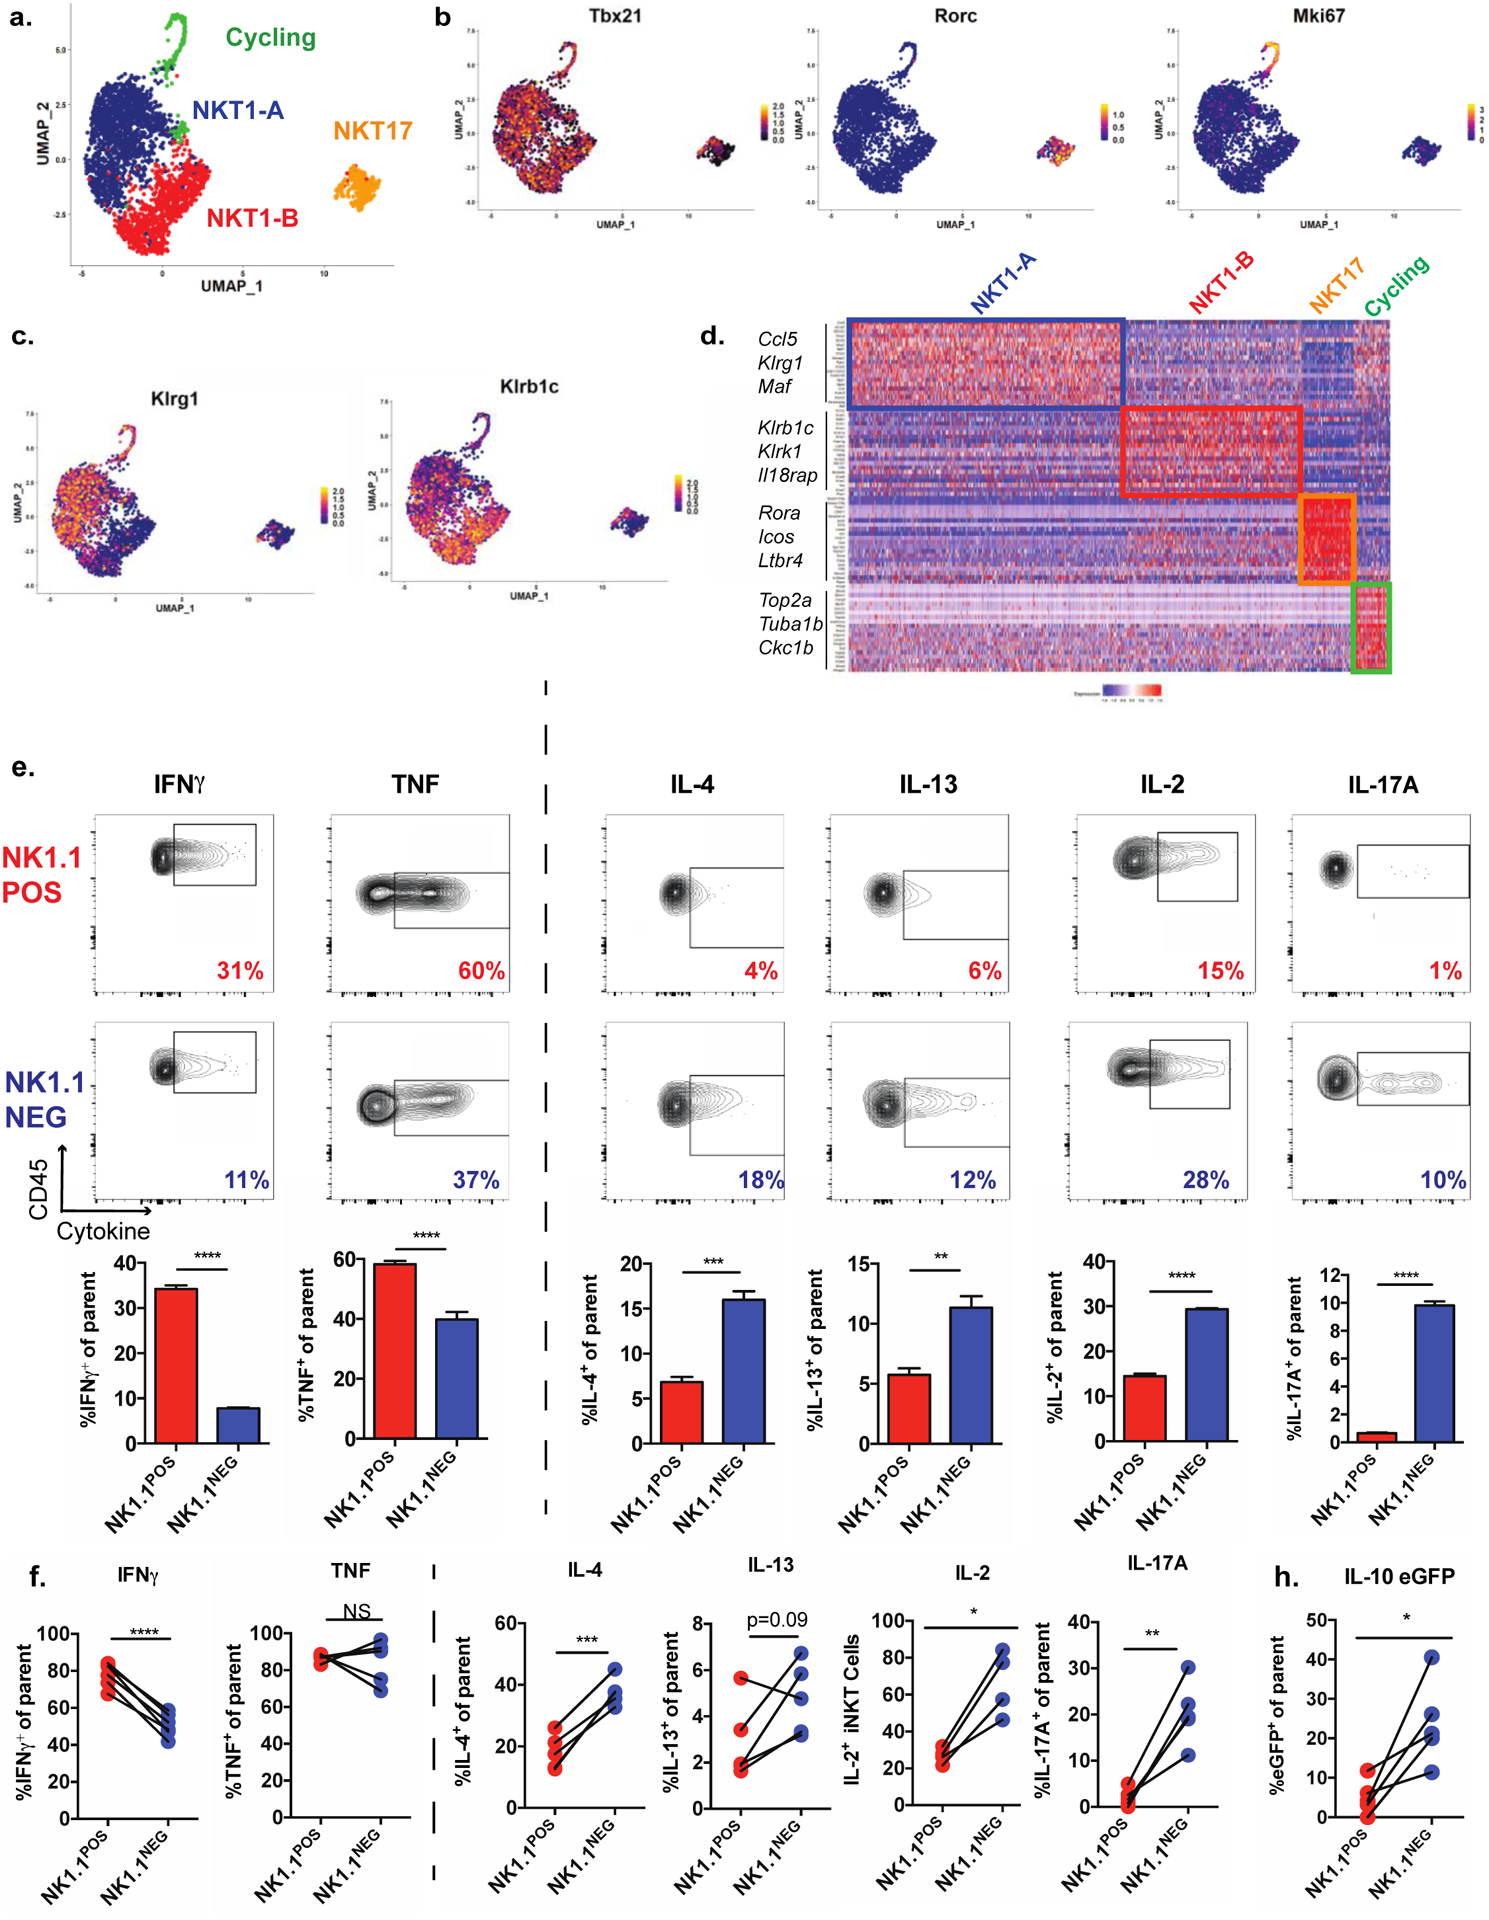
Figure 2. Transcriptional and functional diversity among adipose tissue iNKT cells.

(a) UMAP of scRNA-seq data from adipose tissue iNKT cells, showing cell clusters.
(b-c) Normalized expression of cluster-defining transcription factors (b) and surface markers distinguishing the NKT1-A and NKT1-B clusters (c).
(d) Heatmap representing top 20 overexpressed genes per cell cluster relative to all other cells.
(e) Cytokine levels, as evaluated by intracellular cytokine staining of adipose tissue iNKT cells from Vα14 TN mice pre-sorted based on expression of NK1.1 and then stimulated for 4 hours with PMA/I. CD45 is a pan leukocyte marker used on the Y axes (n = 3 biological replicates plated in triplicate).
(f) Cytokine levels by NK1.1POS and NK1.1NEG iNKT cells, as evaluated by ICS, from the stromal vascular fraction (SVF) from WT mice stimulated with PMA/I for two hours. Each pair of connected dots represents paired cell populations in a single SVF sample (n = 4–6 mice/group).
(g) Percentage of eGFP+ cells among NK1.1POS and NK1.1NEG iNKT cells from the SVF from IL-10 eGFP (TIGER) mice stimulated as in (g) (n = 5 mice).
NS, not significant (P > 0.05); *P < 0.05; **P < 0.01; ***P < 0.001; ****P < 0.0001.. Two-tailed Student’s t-test in e-g; Error bars indicate mean (± S.E.M.). Data are representative of one experiment (a-d) or two or more independent experiments (g-d).
