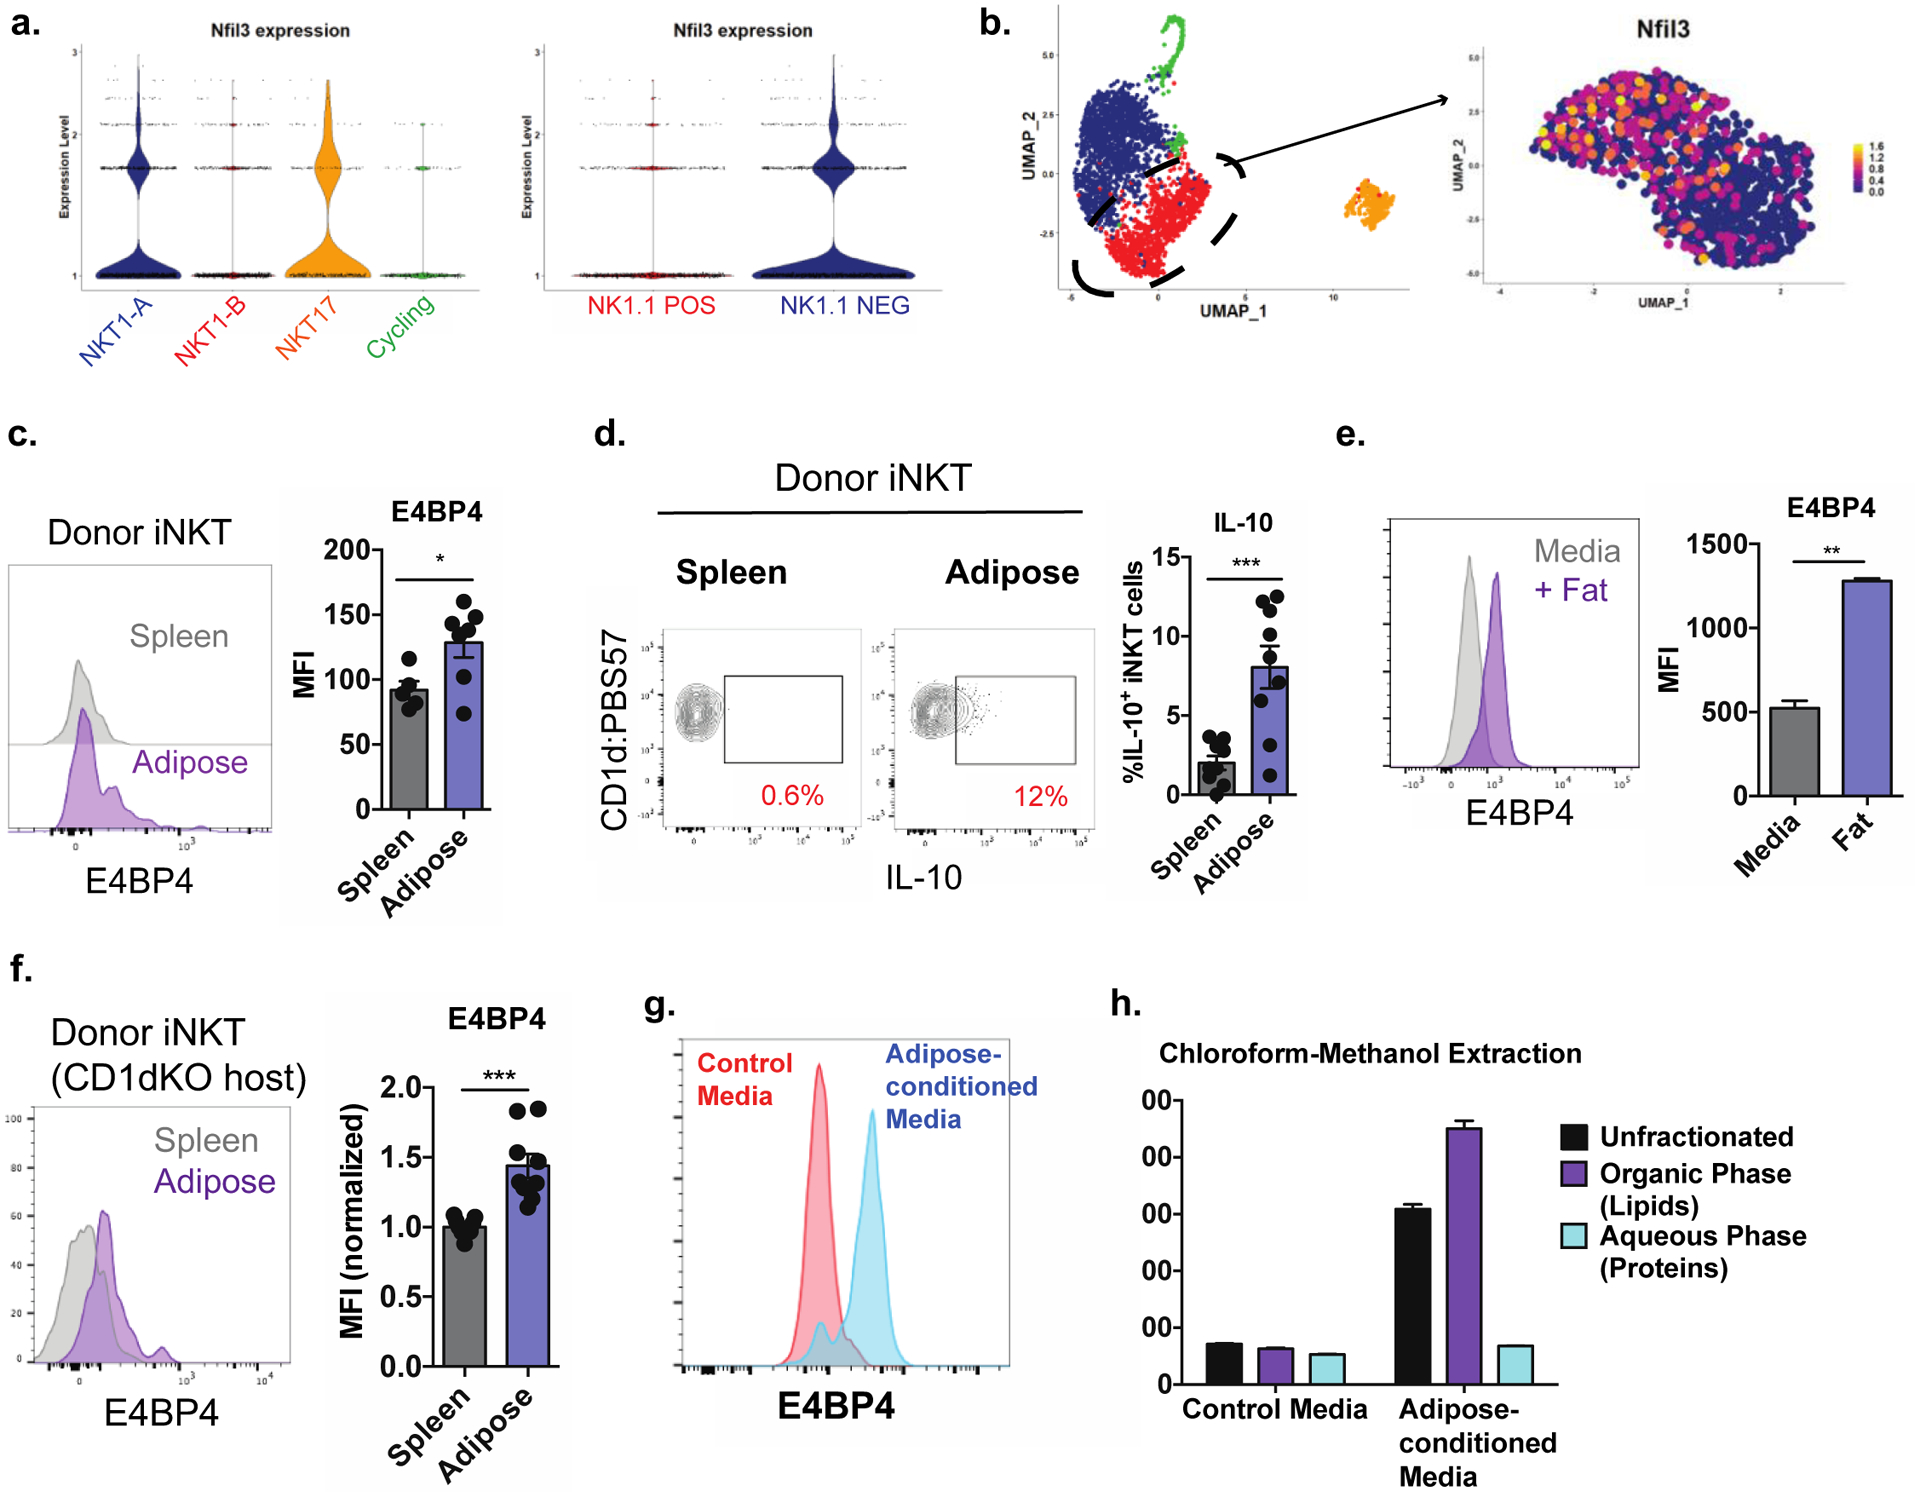
Figure 3. Exposure to adipose tissue lipids induces regulatory iNKT cells.

(a) Expression of Nfil3 in scRNA-seq clusters (left) or in cells from scRNA-seq experiment segregated based on Klrb1c (NK1.1) expression (right).
(b) Expression of Nfil3 within fine-clustered NKT1-B cells.
(c) E4BP4 expression in splenic iNKT cells adoptively transferred into congenically marked mice and recovered from spleen and adipose tissue one week later (n = 5–6 organs per group).
(d) Percentage of IL-10+ donor iNKT cells recovered from spleen and adipose tissue after αGalCer stimulation (n = 9 organs per group).
(e) Expression of E4BP4 in splenic iNKT cells cultured in control media or in the presence of adipose tissue. (n = 2 technical replicates per group).
(f) Expression of E4BP4 in donor splenic iNKT cells recovered from recipient spleen and adipose tissue (n = 9 organs per group).
(g) Expression of E4BP4 in iNKT cells cultured in control media or adipose-conditioned media.
(h) E4BP4 expression in iNKT cells exposed to adipose-conditioned media left unfractionated or fractionated into aqueous and organic phases (n = 3 technical replicates per group).
Error bars indicate mean (± S.E.M.). NS, not significant (P > 0.05); *P < 0.05; **P < 0.01; ***P < 0.001. Two-tailed student’s t-test (c, d, e, f). Data representative of (c) or combined from (d, f) two independent experiments or representative of three or more experiments (e, g, h).
