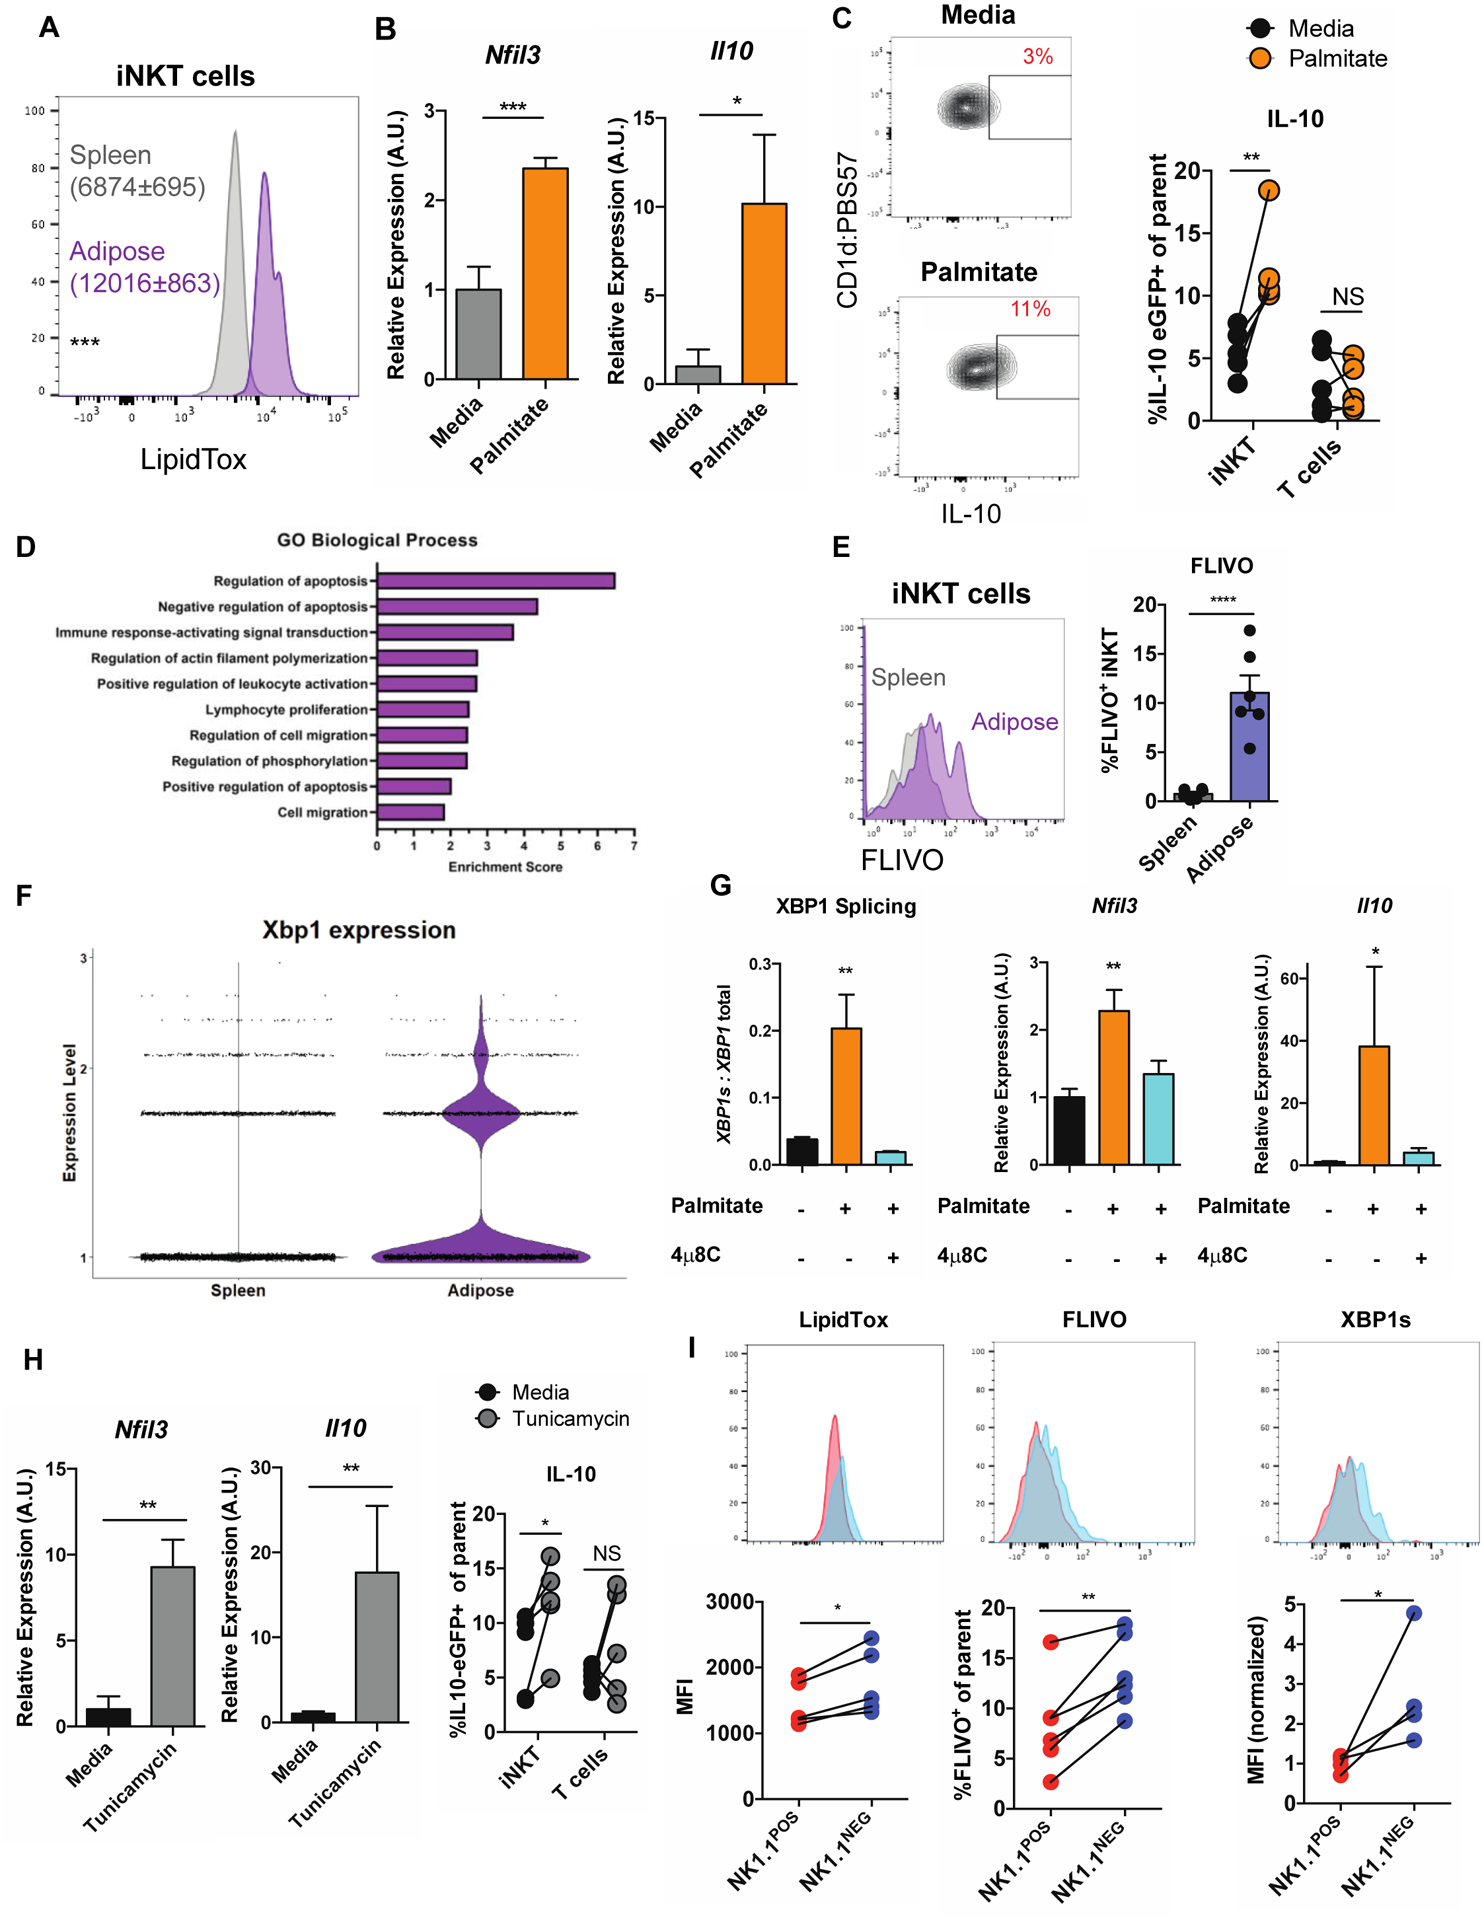
Figure 4. Adipose tissue FFAs drive E4BP4 expression and IL-10 production in iNKT cells via the IRE1α-XBP1s arm of the UPR.

(a) LipidTox expression in splenic versus adipose iNKT cells (n = 5 mice).
(b) Relative expression of Nfil3 and Il10 in iNKT cells cultured in control media or in the presence of palmitate (n = 6 technical replicates/group).
(c) Percentage of IL-10 eGFP+ adipose iNKT cells, based on NK1.1 expression, after PMA/I stimulation (n = 5 paired biological replicates).
(d) Top enriched GO terms in adipose iNKT cells over splenic iNKT cells
(e) Percentage of FLIVO+ iNKT cells in spleen and adipose tissue (n = 6 mice).
(f) Expression of XBP1 in splenic and adipose iNKT cells from scRNA-seq.
(g) Relative expression of indicated genes in iNKT cells cultured in the presence of control media, palmitate, or palmitate and 4μ8c (n = 6 technical replicates / group).
(h) Relative expression of Nfil3 and Il10 in iNKT cells cultured in control media or tunicamycin (n = 4–9 technical replicates/group, representative of 3 biological replicates).
(i) Flow cytometry staining of LipidTox, FLIVO and XBP1s in NK1.1POS versus NK1.1NEG adipose iNKT cells (n =4–5 mice per group).
Error bars indicate mean (± S.E.M.). NS, not significant (P > 0.05); *P < 0.05; **P < 0.01; ***P < 0.001. Two-tailed unpaired Student’s t-test (a, b, e, g). Two-tailed paired Student’s t-test (c, h). MAST test (f). ANOVA with post hoc Tukey’s test (g). Data representative of three (a, b, g) or two (i), or one (f) or combined from two (c) or three (h) independent experiments.
