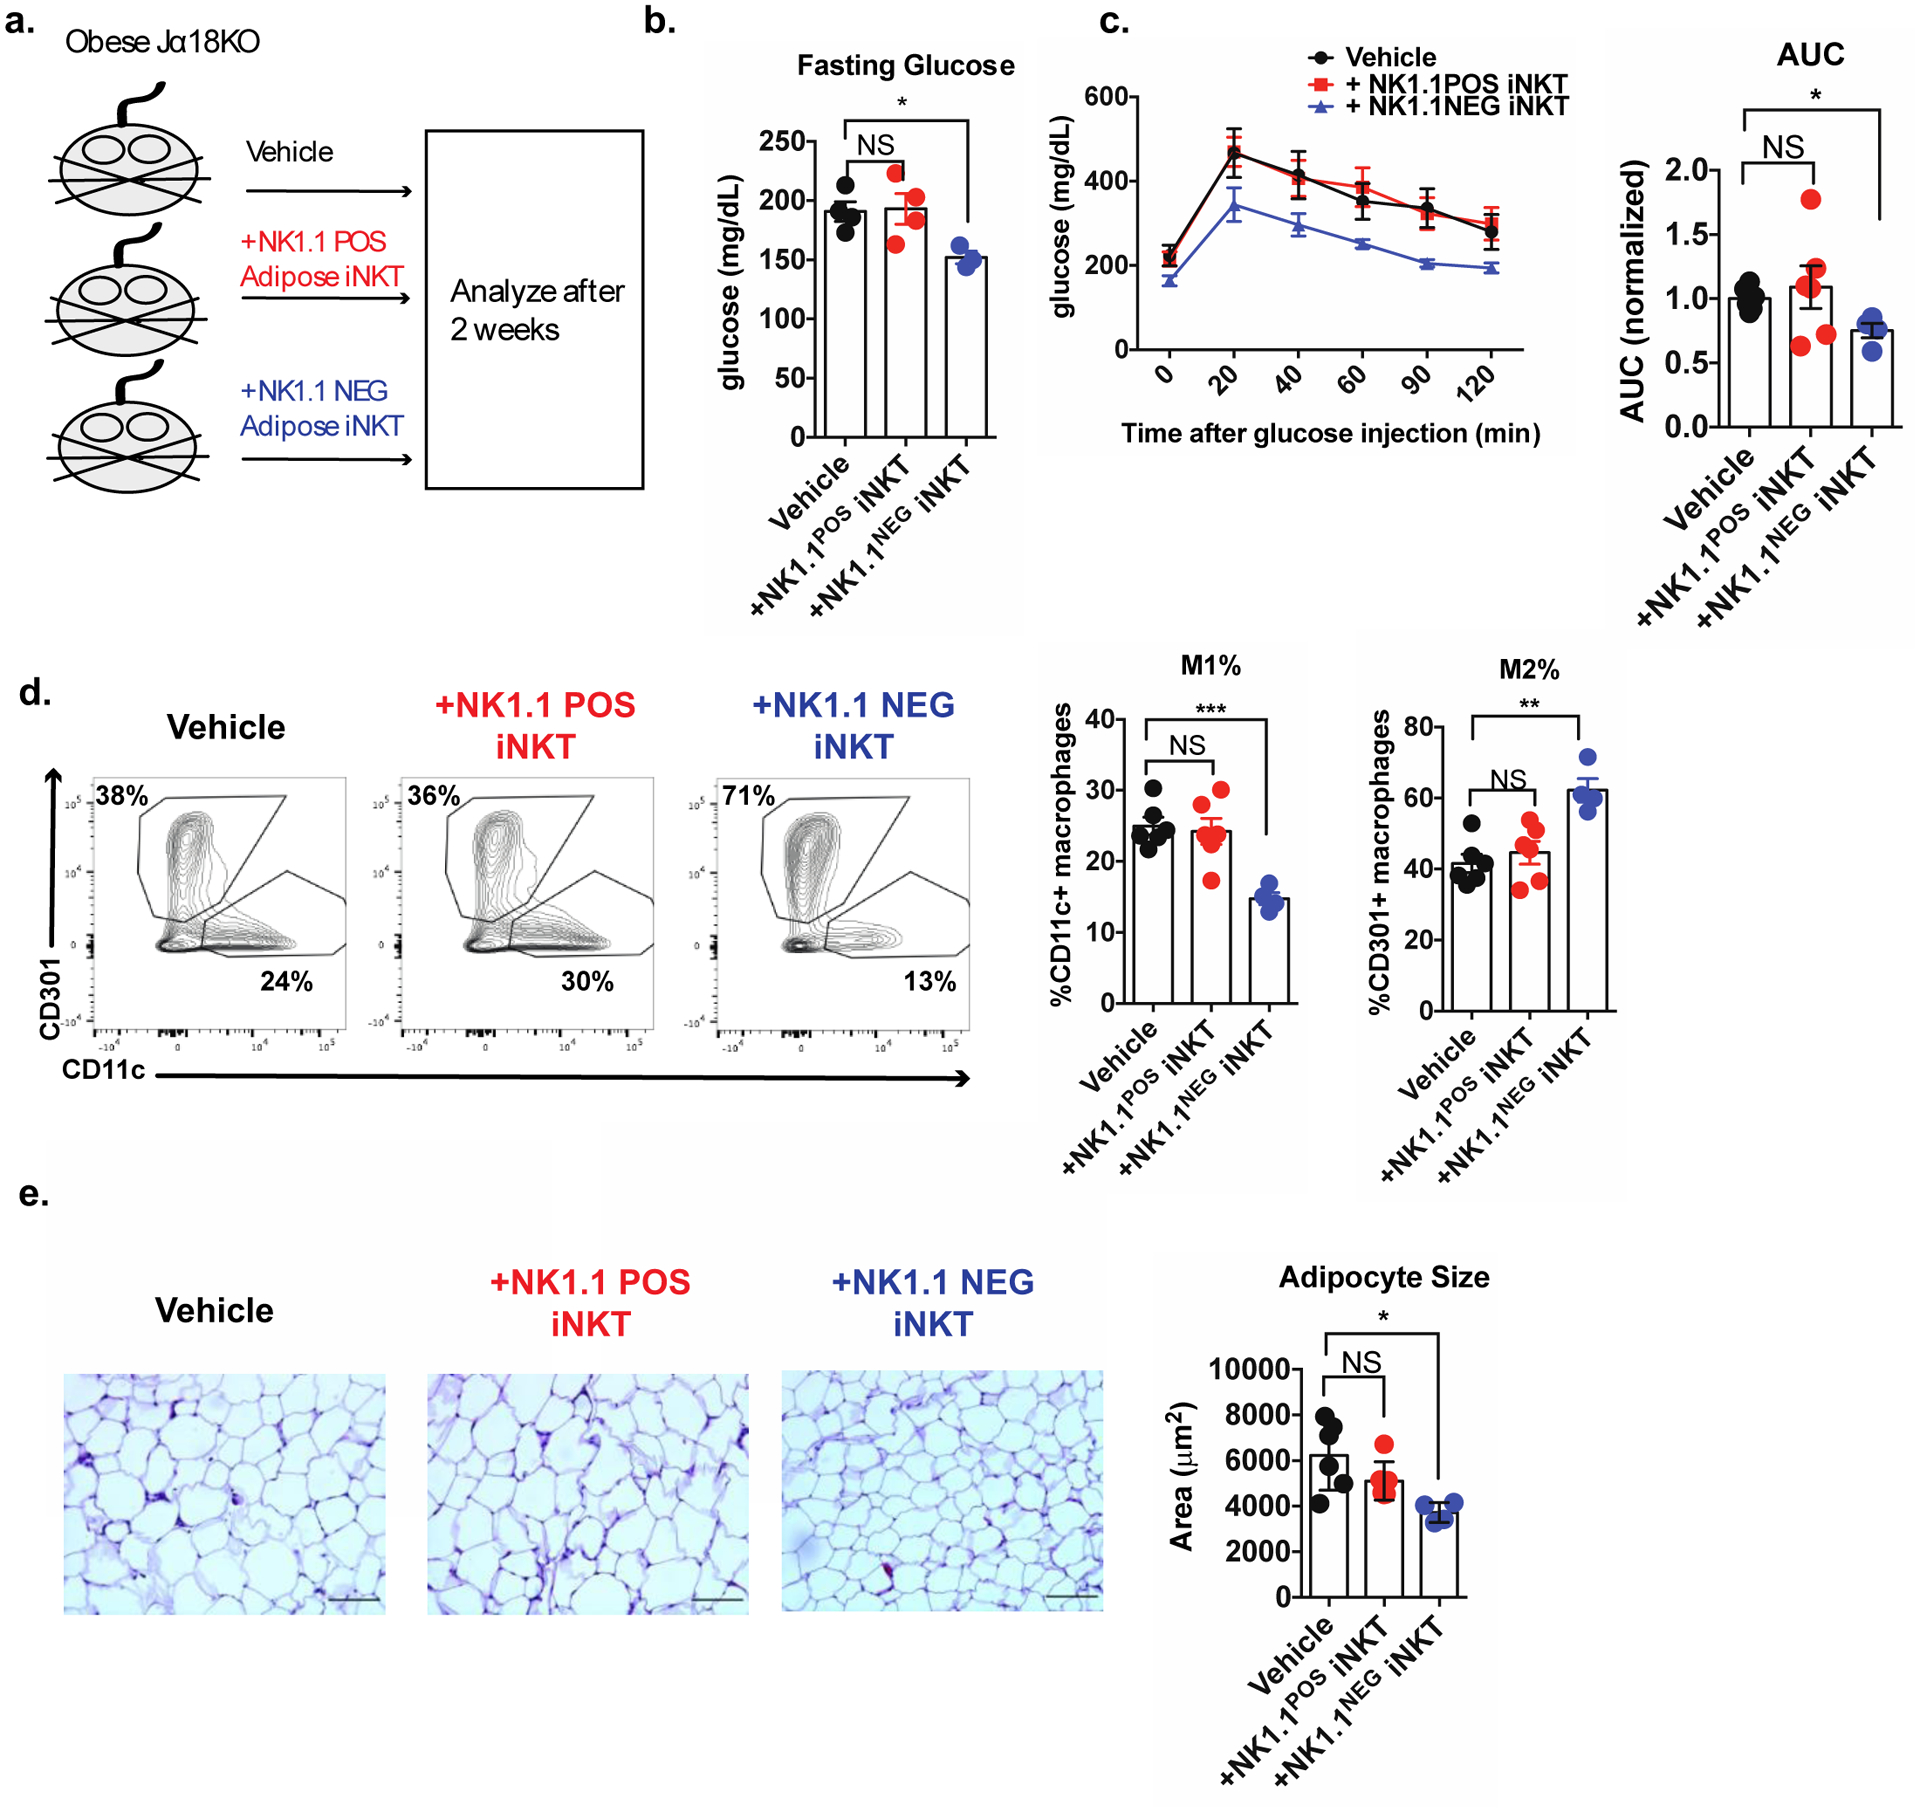
Figure 5. NK1.1NEG iNKT cells selectively restore glycemic control during obesity.

(a) Schematic diagram outlining the adoptive transfer experiment.
(b-c) Fasting glucose (b) and glucose tolerance test (c) of mice receiving treatments indicated in (a).
(d) Percentage of ATMs (CD45+CD11b+F4/80+) expressing canonical M1 (CD11c) and M2 (CD301) markers.
(e) Average adipocyte area of mice receiving indicated treatments. Scale bars = 100 μm. (representative images of 4–6 mice per group).
Error bars indicate mean (± S.E.M.). NS, not significant (P > 0.05); *P < 0.05; **P < 0.01; ***P < 0.001. Two tailed Student’s t-test with Bonferroni correction (b, d) or ANOVA with post-hoc Dunnet test for multiple comparisons (c). n = 4–6 mice per group, representative of (b) or pooled from (c, d, e) two independent experiments.
