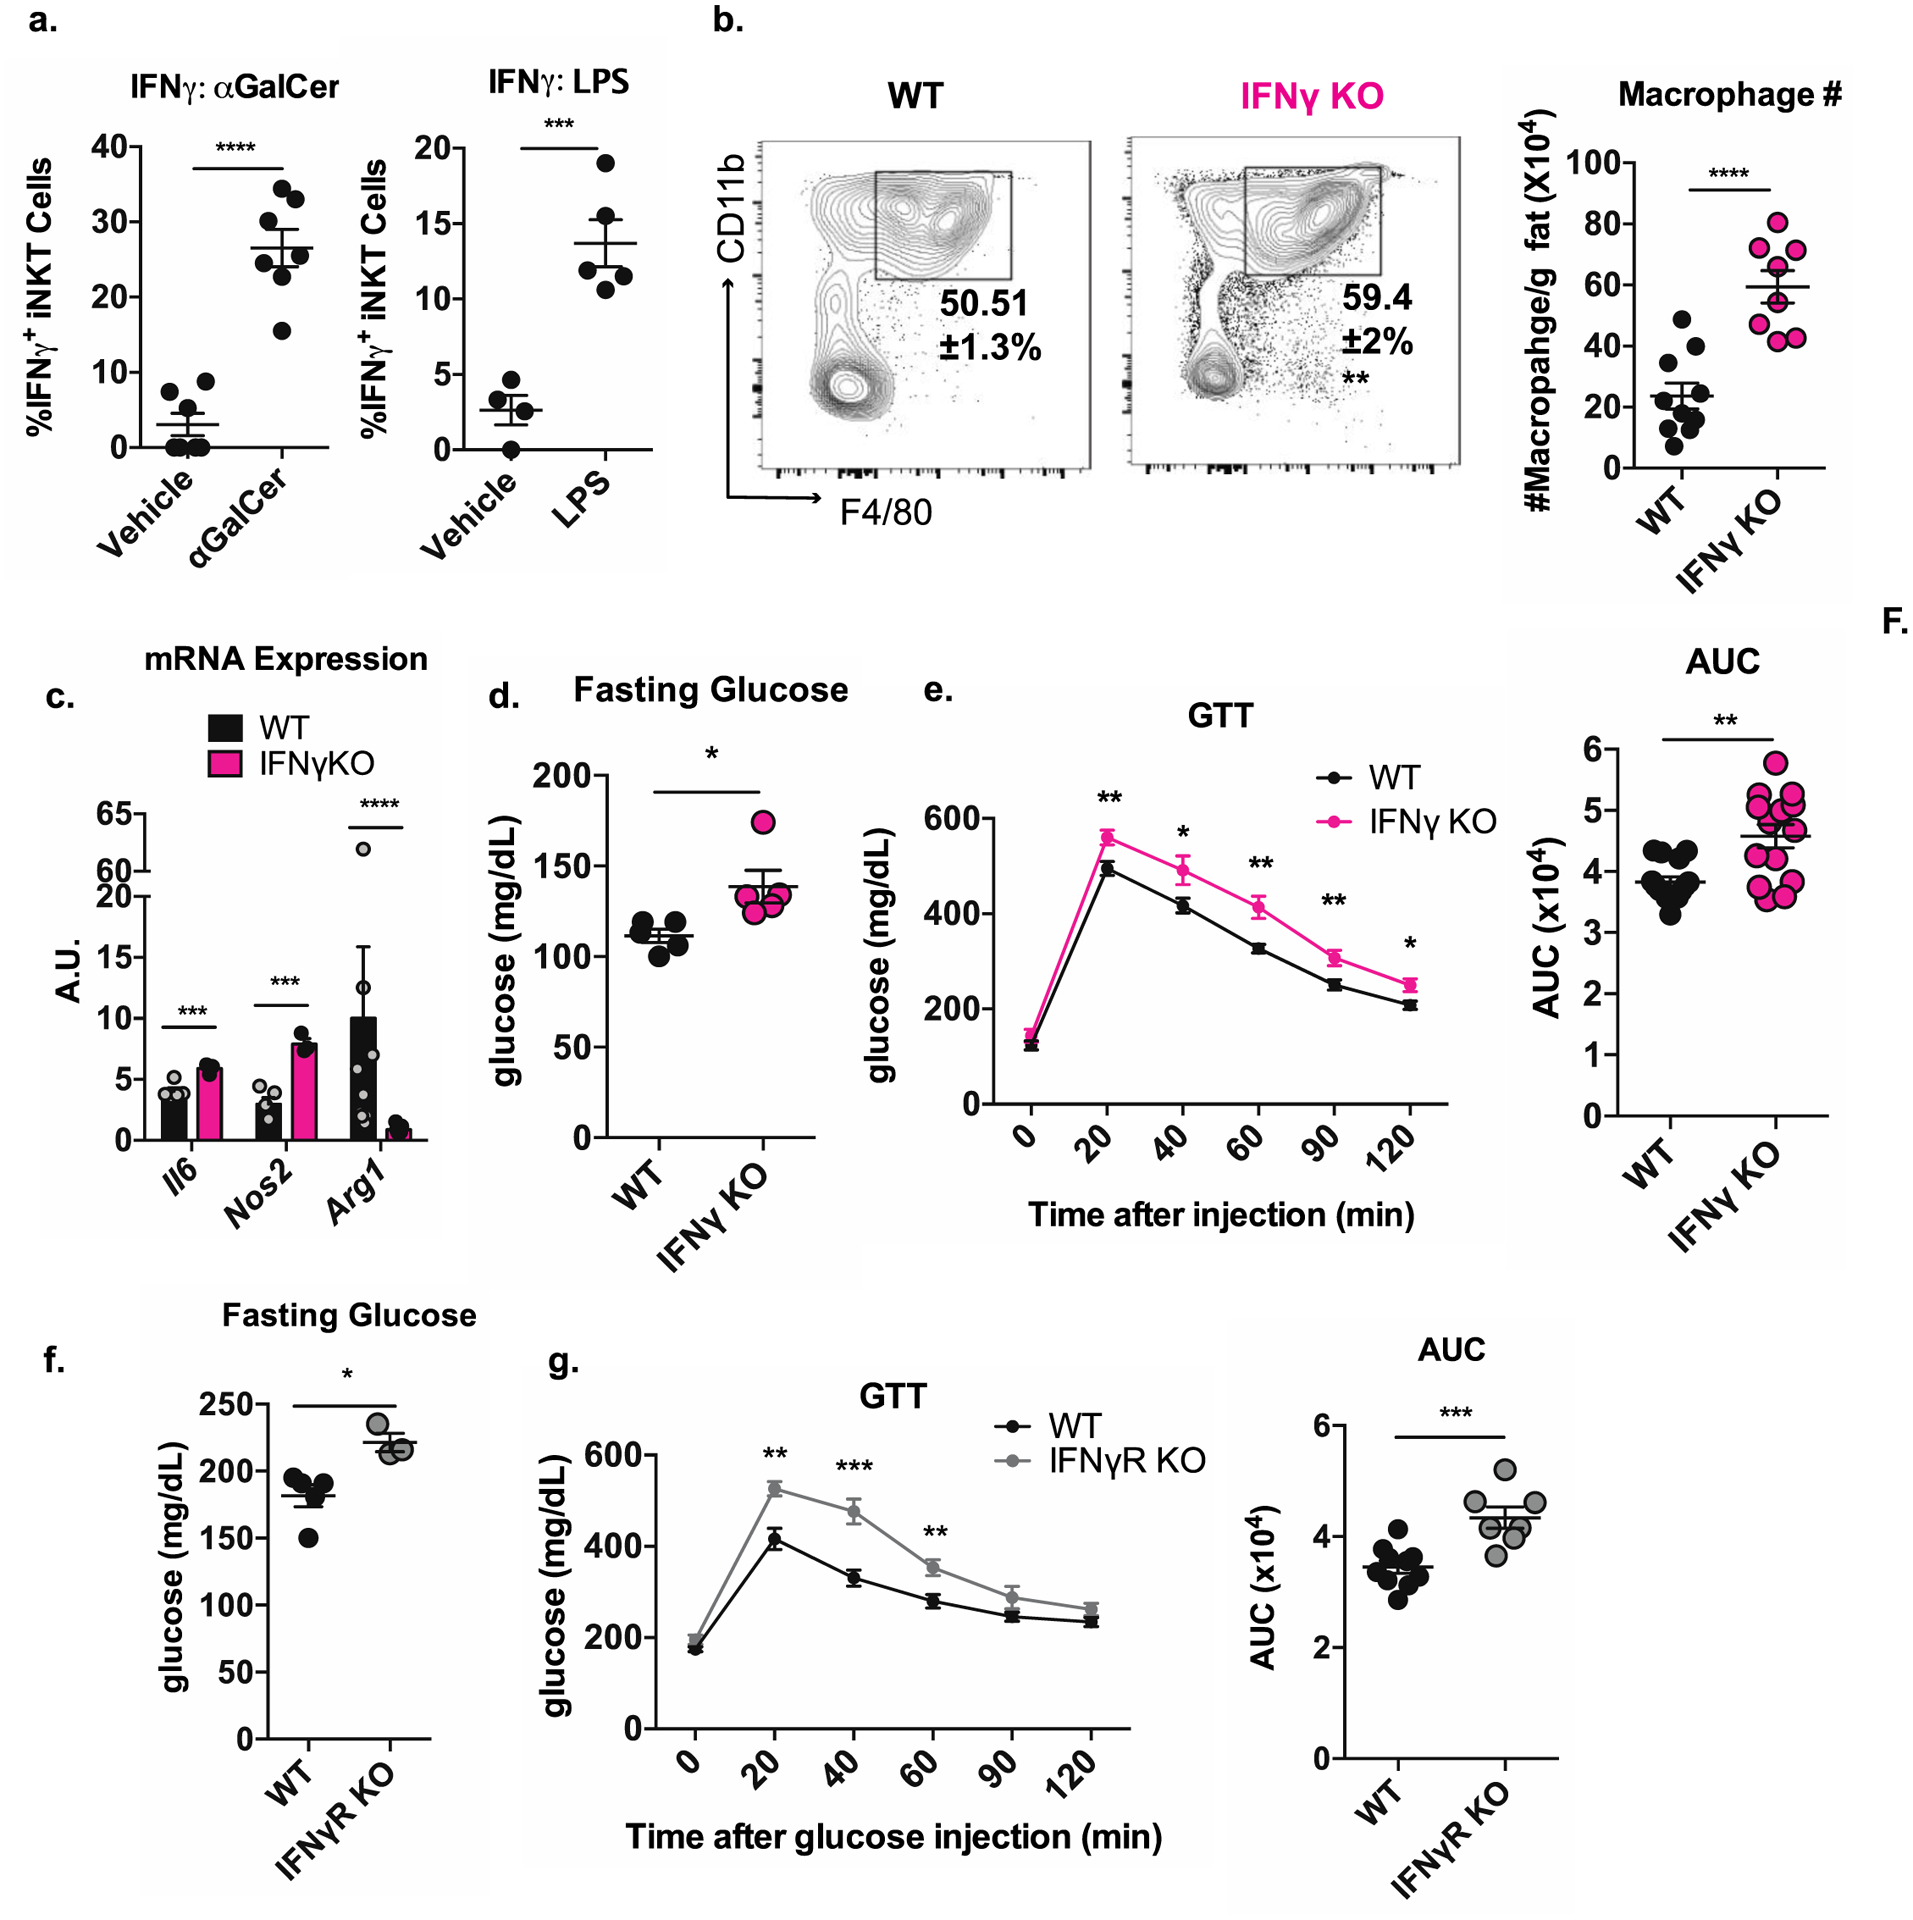
Figure 6. Adipose tissue iNKT cells produce IFNγ, which is required for proper metabolic function in lean fat.

(a) Percentage of IFNγ+ adipose tissue iNKT cells from mice injected with vehicle or αGalCer (left) or vehicle or LPS (right) four hours prior (n = 4–7 mice per group).
(b) Percentage among CD45+ and absolute number of ATMs in WT versus IFNγ KO mice (n = 8–10 mice per group).
(c) Transcript levels Il6, Nos2, and Arg1 in adipose tissue of WT and IFNγ KO mice (n = 3–7 mice per group).
(d-e) Fasting glucose (d) and glucose tolerance test (e) of WT versus IFNγ KO mice (n = 14–15 mice per group).
(f-g) Fasting glucose (f) and glucose tolerance test (g) of WT versus IFNγR KO mice (n = 7–10 mice/group).
NS, not significant (P > 0.05); *P < 0.05; **P < 0.01; ***P < 0.001. Two tailed Student’s t-test. Mann Whitney U test was use to assess significance for Arg1 in Fig. 6c, as the data were not normally distributed. Error bars indicate mean (± S.E.M.). Data representative of (a, b, c, e, f, g, i) or combined from (d, h) two independent experiments.
