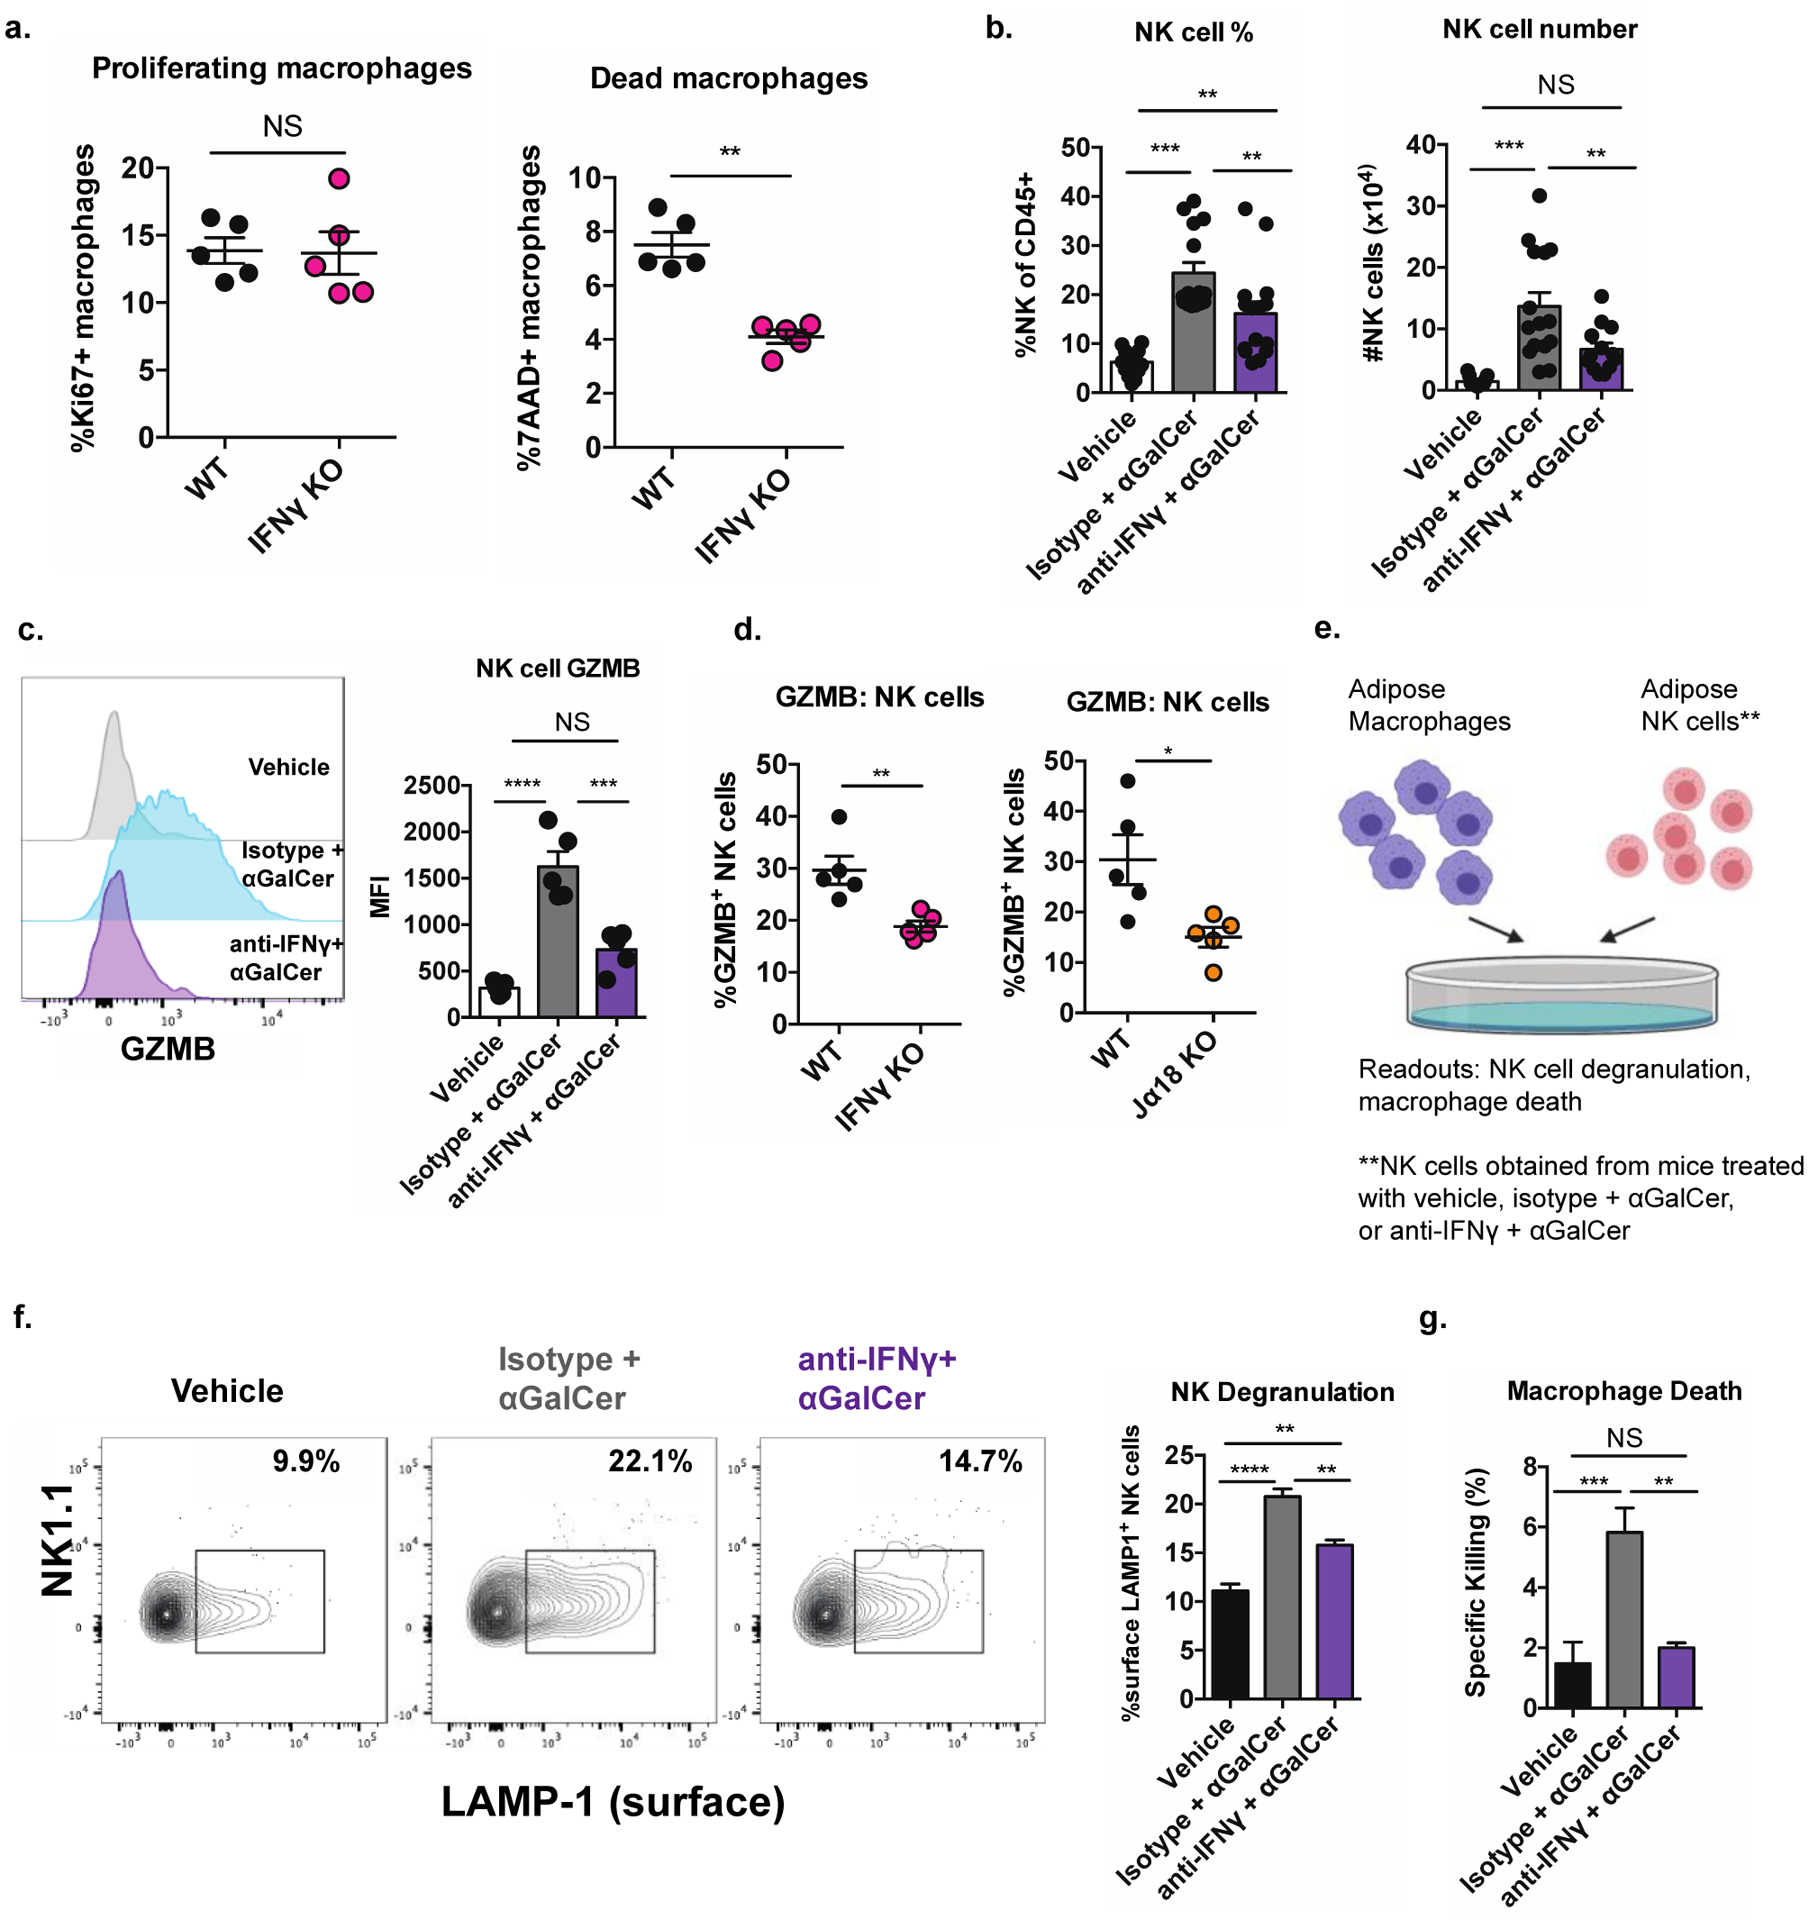
Figure 7. iNKT cell-derived IFNγ licenses NK cell cytotoxicity against ATMs in lean mice.

(a) Percentage of Ki67+ (left) and 7-AAD+ (right) ATMs WT and IFNγ KO mice (n = 5 mice/group).
(b) Percentage (left) and number (right) of adipose tissue NK cells from mice given the indicated treatments three days prior to analysis (n= 14–15 mice per group).
(c) Expression of GZMB in adipose NK cells of mice treated as in (b) (n = 5 mice per group).
(d) Expression of GZMB in adipose NK cells of Jα18KO and IFNγ KO mice compared to WT controls (n = 5–6 mice per group).
(e) Diagram of cytotoxicity assay.
(f-g) Percentage of surface LAMP-1+ NK cells (reflecting degranulation) (f) and percentage of dead ATMs (g) resulting from coculture of ATMs with adipose NK cells from mice treated as in (b) (n = two biological replicates, plated in triplicate).
NS, not significant (P > 0.05); *P < 0.05; **P < 0.01; ***P < 0.001. ANOVA with post-hoc Tukey test (b, c, f, g) or Two tailed Student’s t-test (a, d). Error bars indicate mean (± S.E.M.). All data representative of two independent experiments (c-f) or combined from three independent experiments (b) or one experiment (a). For panel b, two outliers were eliminated using a ROUT test with Q = 0.1% or Grubb’s test with alpha = 0.05
