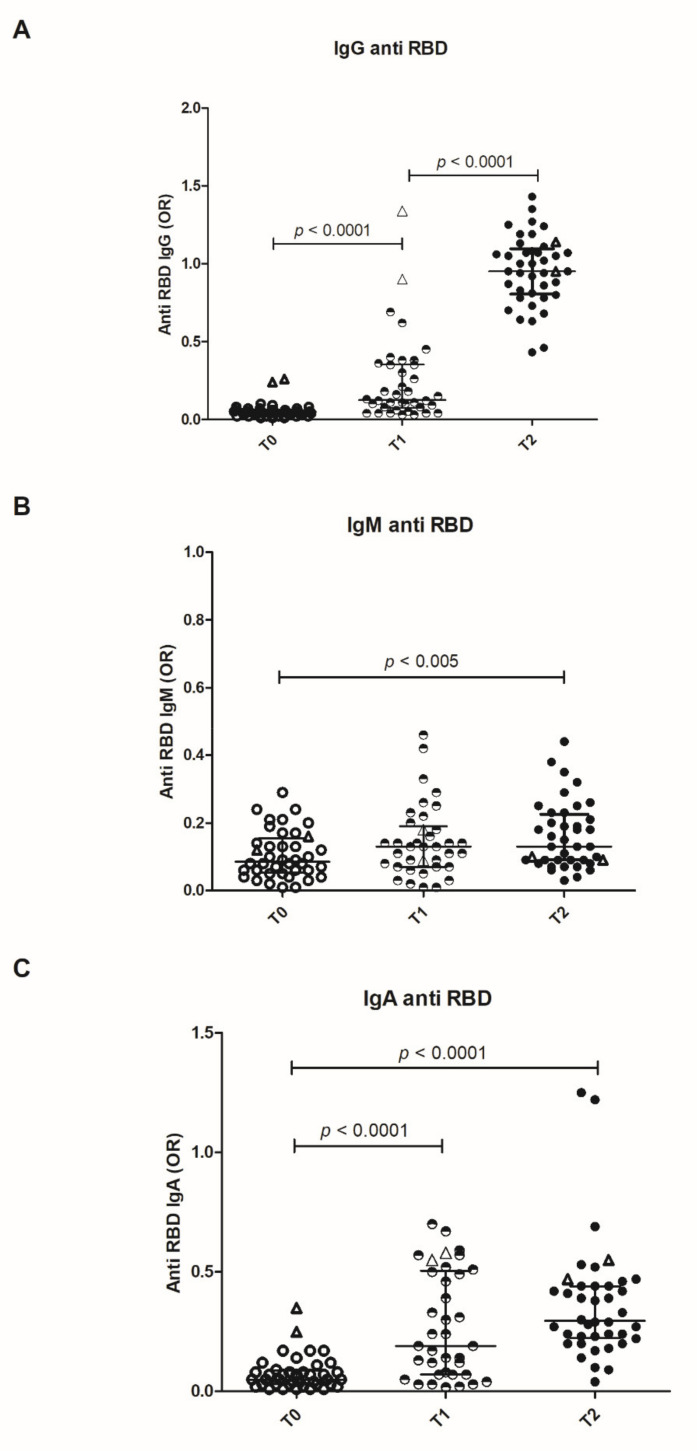
Figure 1.
Distribution of anti-receptor binding domain immunoglobulins. Distribution of IgG (A), IgM (B) and IgA (C) anti-RBD antibodies at the baseline (T0), after the first dose (T1) and after the booster (T2) are shown. Results are expressed as odds ratio of an internal control (OR). Bars represent Median and interquartile range (IQR). The empty triangles represent the two vaccinated convalescent subjects. In these ones, IgG anti-RBD are detectable at the baseline and markedly increased after the first dose.

