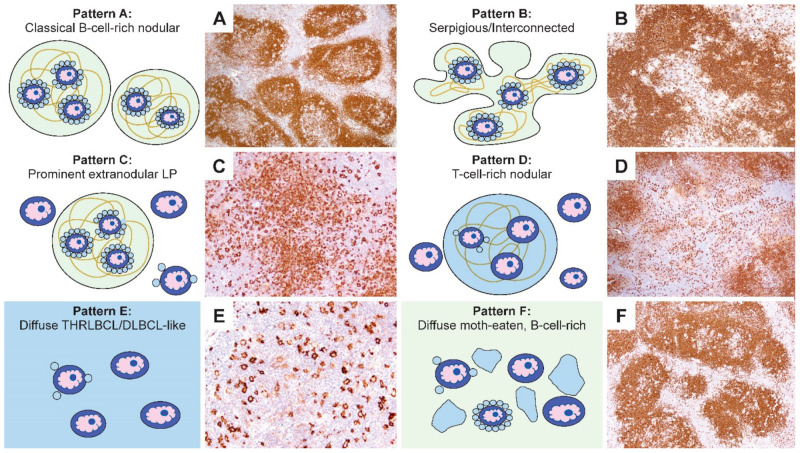
Figure 4.
Comparison of the schematic representations and CD20-stained NLPHL patterns. (A–F) Representative CD20-stained examples of the six NLPHL patterns highlight the number and localization of the LP cells, as well as the content and configuration of small B cells and T cells in the microenvironment in patterns A–F. [Original magnifications: A,B,D,F ×60; C,E ×150].

