Figure 1.
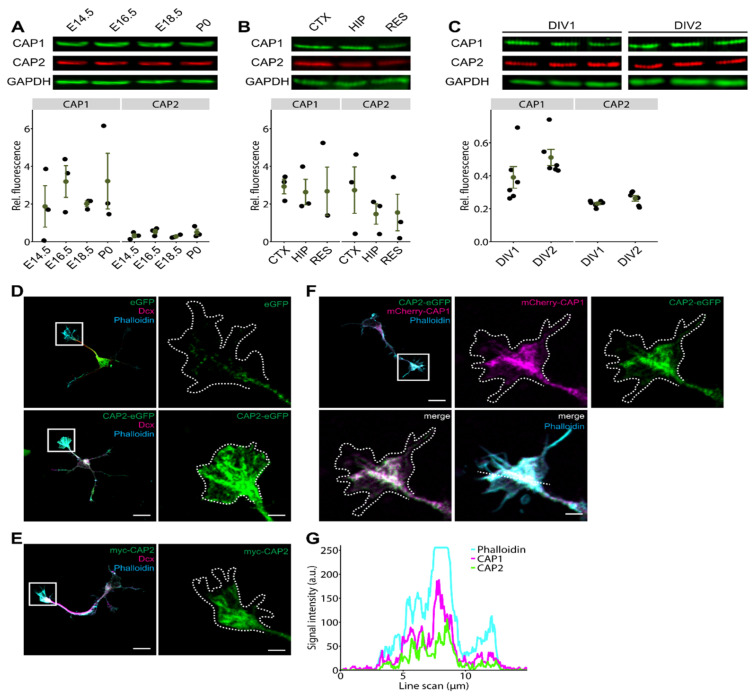
CAP2 is expressed in the embryonic brain and abundant in growth cones. (A) Immunoblots showing presence of CAP1 and CAP2 in cerebral cortex lysates during embryonic development, from embryonic day (E) 14.5 to postnatal day (P) 0. GAPDH was used as the loading control. Graph showing CAP1 and CAP2 levels normalized to the loading control, GAPDH. Black circles: normalized CAP1 and CAP2 levels in three biological replicates. Green circles and error bars: mean values (MV) and standard errors of the means (SEM). (B) Immunoblots showing expression levels of CAP1 and CAP2 in cerebral cortex (CTX) and hippocampus (HIP) lysates at P0. Additionally, lysate of residual brain (RES) was probed. GAPDH was used as the loading control. Graph showing CAP1 and CAP2 levels normalized to the loading control, GAPDH. Black circles: normalized CAP1 and CAP2 levels in three biological replicates. Green circles and error bars: MV and SEM. (C) Immunoblots showing presence of CAP1 and CAP2 in lysates from cultured cortical neurons (three biological replicates) after one and two days in vitro (DIV). GAPDH was used as the loading control. Graph showing CAP1 and CAP2 levels normalized to the loading control, GAPDH. Black circles: normalized CAP1 and CAP2 levels in six biological replicates. Green circles and error bars: MV and SEM. (D) Micrographs of hippocampal neurons at DIV1 expressing either GFP or GFP-CAP2 (green). Neurons were counterstained with the F-actin dye phalloidin (cyan) and the microtubule-associated protein doublecortin (Dcx, magenta). Boxes indicate areas shown at higher magnification, dashed lines outline growth cones as deduced from phalloidin staining. (E) Micrograph of a hippocampal neuron at DIV1 expressing myc-CAP2 visualized by myc antibody staining (green). Neuron was counterstained with phalloidin (cyan) and Dcx (magenta). Box indicates area shown at higher magnification, dashed line outlines growth cone. (F) Micrograph of a hippocampal neuron at DIV1 expressing GFP-CAP2 (green) and mCherry-CAP1 (magenta). Neuron was counterstained with phalloidin (cyan). Box indicates area shown at higher magnification, dashed line outlines growth cone. (G) Fluorescence intensity profile of GFP-CAP2, mCherry-CAP1 and phalloidin along white line shown in merge in G. Scale bars (in µm): 10 (low magnifications in (D–F)), 2 (high magnifications in (D–F)).

