Figure 5.
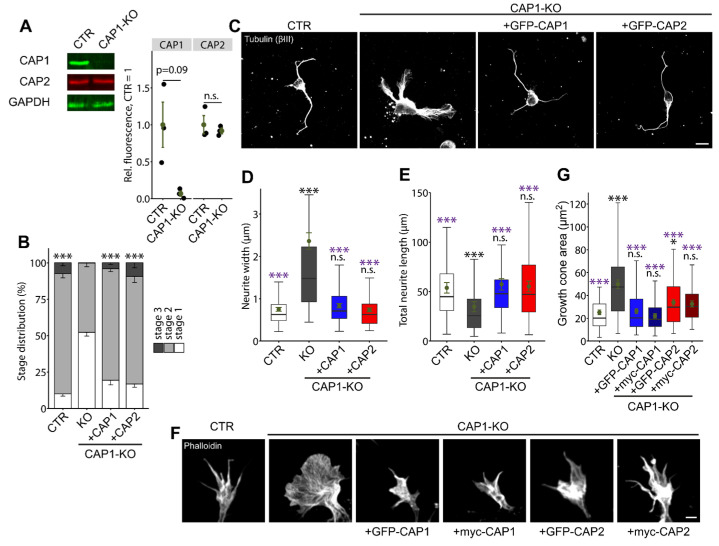
CAP2 overexpression partially rescues morphological changes in CAP1-KO neurons. (A) Immunoblots of three biological replicates showing absence of CAP1 from the CAP1-KO brain and unchanged expression of CAP2. GAPDH was used as the loading control. Graph showing CAP1 and CAP2 levels normalized to the loading control, GAPDH with CAP1 set to 1 in CAP1-KO brain lysates. Black circles: normalized CAP1 and CAP2 levels in three biological replicates. Green circles and error bars: MV and SEM. (B) Stage distribution of DIV1 CTR neurons, CAP1-KO neurons, and CAP1-KO neurons expressing either GFP-CAP1 or GFP-CAP2. (C) βIII-tubulin-stained neurons (CTR, CAP1-KO, and CAP1-KO expressing either GFP-CAP1 or GFP-CAP2) that were used for the analysis of neurite width and total neurite length shown in (D,E). (F) Growth cones from phalloidin-stained neurons (CTR, CAP1-KO, and CAP1-KO expressing either GFP- or myc-tagged CAP1 or GFP- or myc-tagged CAP2) that were used for the analysis of growth cones size shown in (G). Scale bars (in µm): 10 (C), 2 (F). n.s.: p ≥ 0.05, * p < 0.05, *** p < 0.001. Error bars represent SEM. Black asterisks and n.s. indicate comparison to CTR neurons and purple asterisks and n.s. indicate comparison to CAP1-KO neurons.

