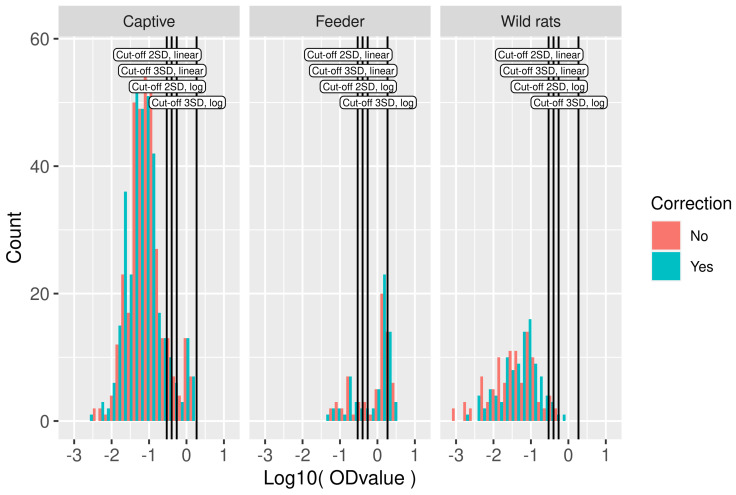
Figure 2.
Serological data used in model fitting. Histogram of logOD values by study. Cut-off values based on the mean OD values in the wild rat dataset plus two or three standard deviations in log10-scale and linear scale are indicated by vertical lines. On the y axis, the count is presented, i.e., the number of rats with an OD value within the range of logOD values covered by the width of the bar.

