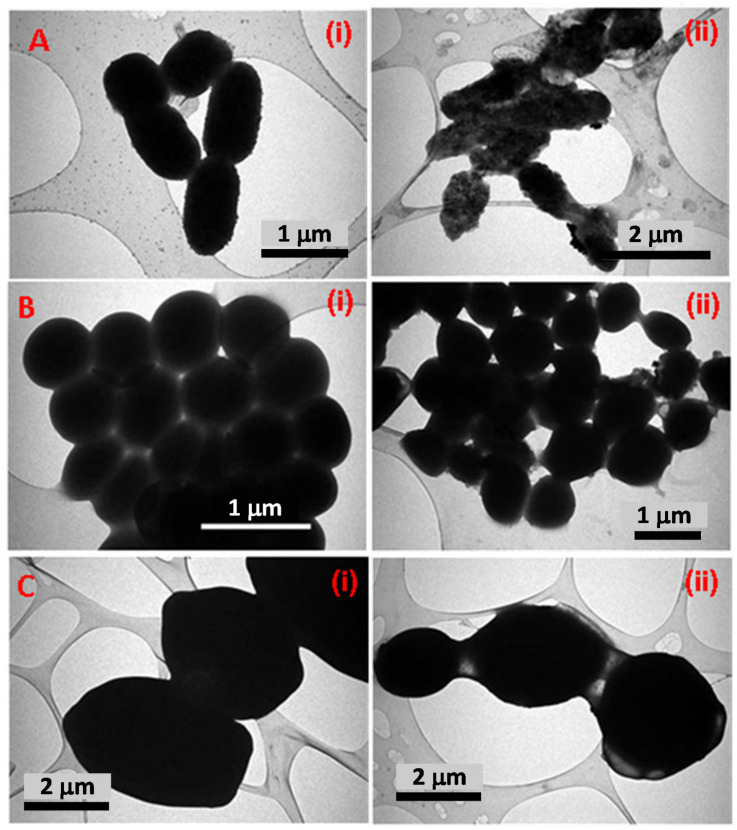
Figure 9.
Shows a TEM-based comparative analysis of the interaction of TCE-Ag-3 NPs with test microbial cells. Panels (i) in (A–C) show TEM images of untreated MDR-PA, MRSA, and C. albicans cells, whereas panels (ii) in (A–C) show TEM images of MDR-PA, MRSA, and C. albicans cells treated with their MIC of TCE-Ag-3 NPs after 24 h.

