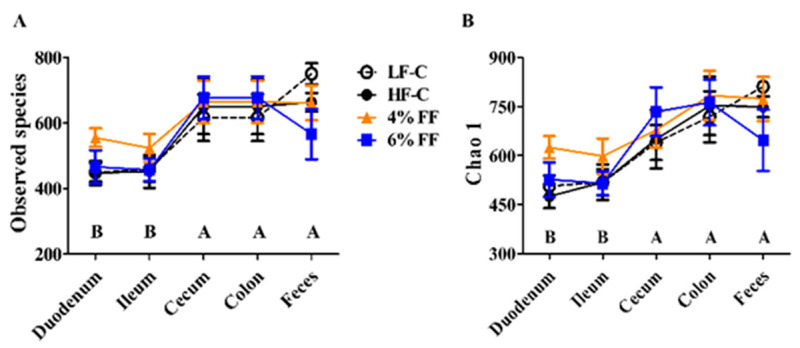
Figure 2.
Changes in microbial α diversity in different intestinal segments: (A) the number of observed OTUs, and (B) the bias-corrected Chao richness estimator (Chao 1). Data are represented as mean ± S.E.M., n = 5–7. Significance is considered at p < 0.05. AB means in the same bar without a common letter differ at p < 0.01.

