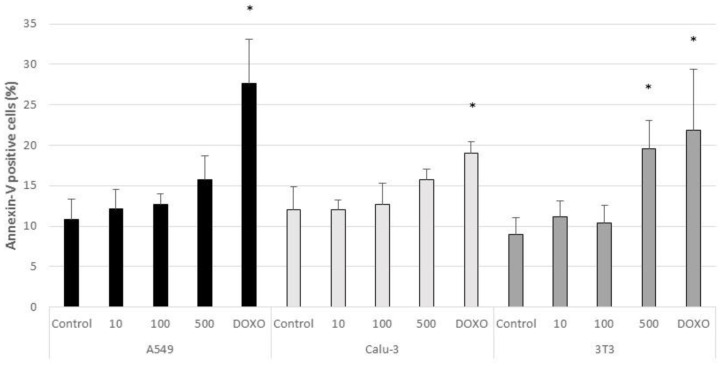
Figure 6.
Apoptosis in control A549, Calu-3, and 3T3 cells and in cells exposed for 24 h to CeO2-NPs (10, 100, and 500 µg/mL), and to the positive control Doxorubicin. Results are expressed as means ± SD of six replicates per tested condition and three independent assays (n = 18). Asterisks indicate significant differences with respect to the untreated control cells (p < 0.05).

