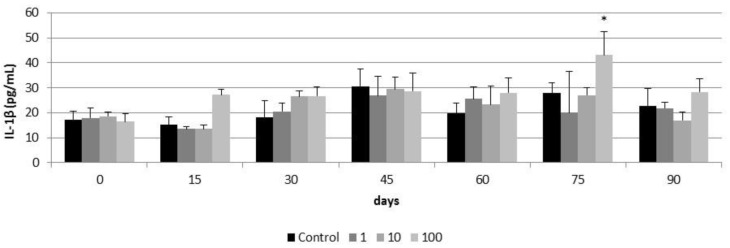
Figure 13.
IL-1β release in control airway epithelia and in airway epithelia exposed for 90 days to different concentrations of CeO2-NPs (1, 10, and 100 µg/cm2). Exposures were performed every two weeks for three months. Results are expressed as means ± SD of five replicates per tested condition and one assay (n = 5). The asterisk indicates significant differences with respect to the untreated control cells (p < 0.05).

