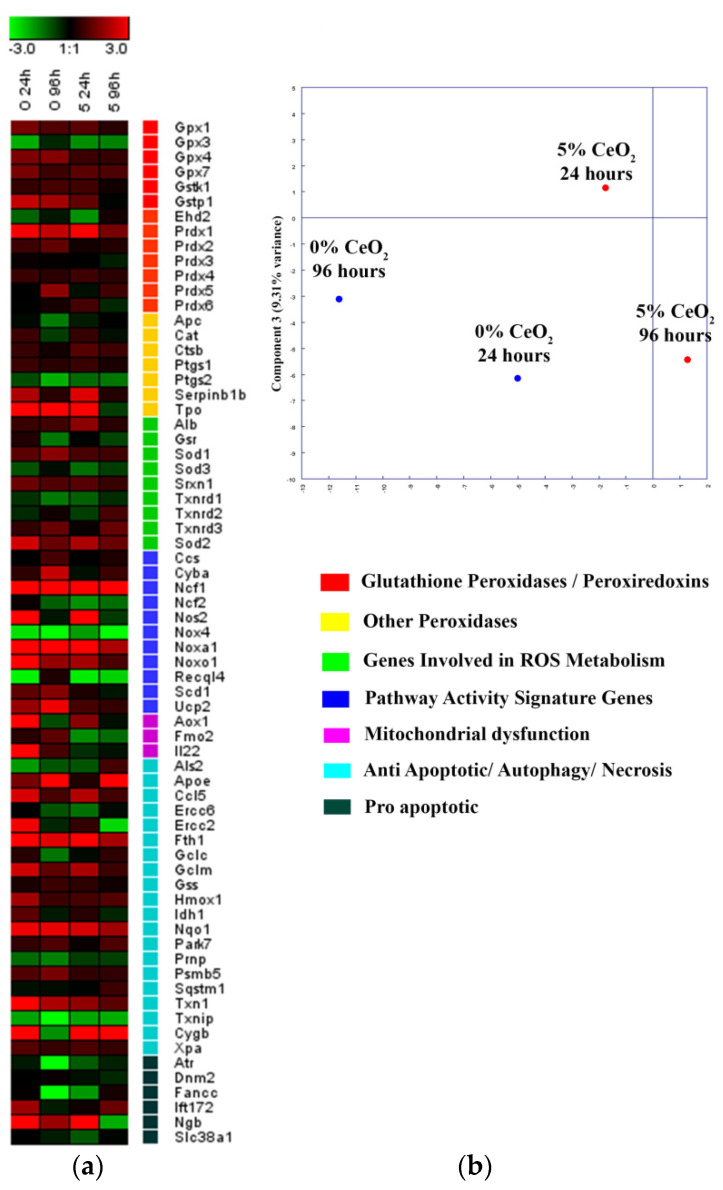
Figure 9.
Heat map of gene expression in mouse MSC, cultured on 0% and 5% CeO2-containing scaffolds, after 24 and 96 h of cultivation. (a) The intensity scale of the standardized expression values ranges from −3 (green: low expression) to +3 (red: high expression, with 1:1 intensity value (black) representing the control (nontreated). Principal component analysis (PCA) of qRT-PCR data for different concentrations of CeO2 scaffold (b). Cluster groups of genes and their functionality.

