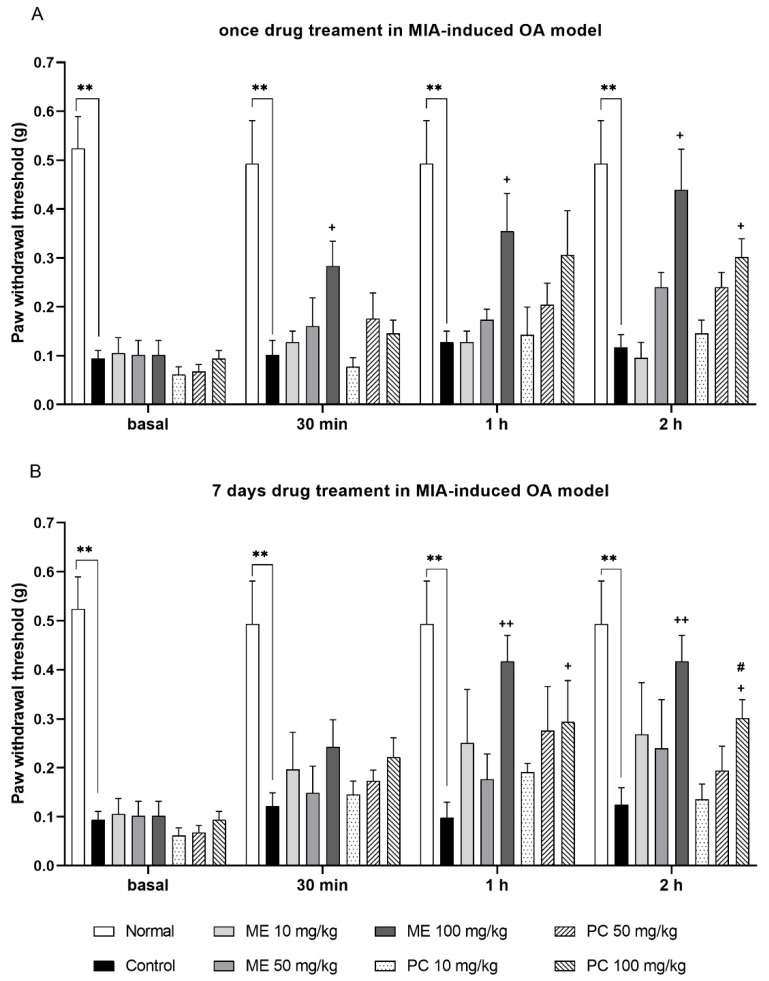
Figure 2.
The antinociceptive effect of ME and PC administered orally in the MIA-induced OA model. Mice were administered orally with the vehicle, ME (from 10 to 100 mg/kg), or PC (from 10 to 100 mg/kg), and then were measured for pain threshold at 30, 60, and 120 min after treatment using the von-Frey test. (A) Mice were treated with the vehicle, ME, or PC once (basal: Normal vs. Control p = 0.0073; 30 min: Normal vs. Control p = 0.0089, Control vs. ME 100 mg/kg p = 0.0313; 1 h: Normal vs. Control p = 0.0095, Control vs. ME 100 mg/kg p = 0.0182; 2 h: Normal vs. Control p = 0.0084, Control vs. ME 100 mg/kg p = 0.0137, Control vs. PC 100 mg/kg p = 0.0423). (B) Mice were administered orally with the vehicle, ME, or PC for 1 week (basal: Normal vs. Control p = 0.0067; 30 min: Normal vs. Control p = 0.0099, Control vs. ME 100 mg/kg p = 0.0313; 1 h: Normal vs. Control p = 0.0089, Control vs. ME 100 mg/kg p = 0.0098, Control vs. PC 100 mg/kg p = 0.0159; 2 h: Normal vs. Control p = 0.0085, Control vs. ME 100 mg/kg p = 0.0098, Control vs. PC 100 mg/kg p = 0.0276, ME 100 mg/kg vs. PC 100 mg/kg p = 0.0463). The values denote the mean ± SEM (n = 5). The repeated measurement two-way ANOVA analyzed each quantified result with a Tukey’s post hoc test. **p < 0.01; +p < 0.05, ++p < 0.01; #p < 0.05.

