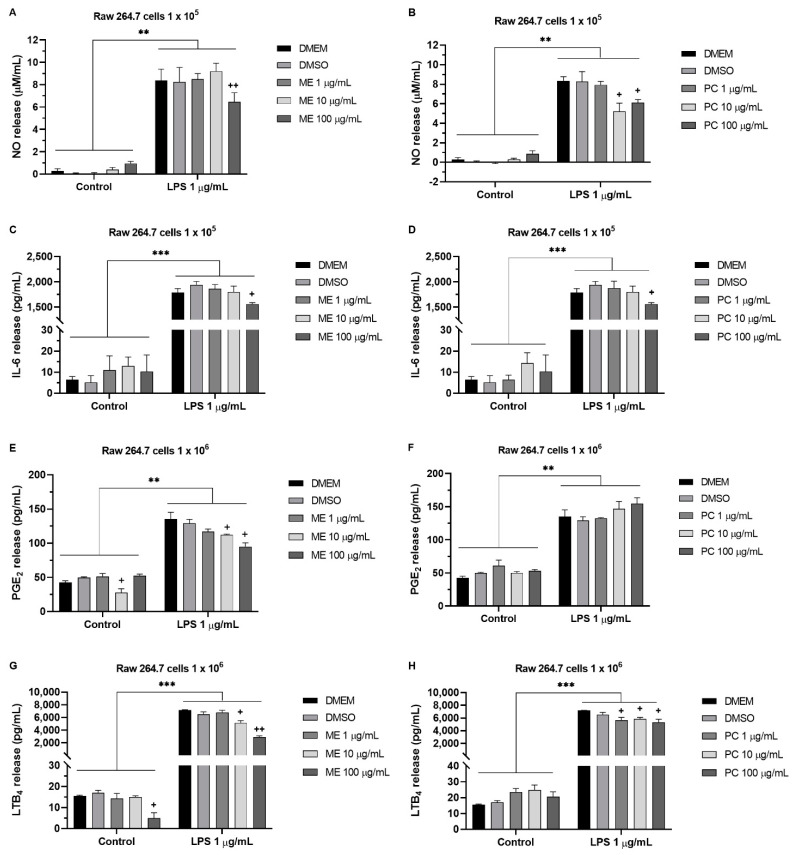
Figure 5.
The effect of ME and PC on LPS-induced NO, IL-6, PGE2, and LTB4 release from cultured RAW 264.7 cells. Several concentrations (1, 10, or 100 µg/mL) of ME or PC were added into the media 1 h prior to LPS treatment. NO (A,B), IL-6 (C,D), PGE2 (E,F), and LTB4 (G,H) levels in the medium were measured after RAW cells were incubated with LPS for 24 h. The vertical bars indicate the mean ± SD (n = 3). NO release: (A) Control vs. LPS 1 µg/mL p = 0.0039, DMSO vs. ME 100 µg/mL p = 0.0097; (B) Control vs. LPS 1 µg/mL p = 0.0048, DMSO VS. PC 10 µg/mL p = 0.0366, DMSO VS. PC 100 µg/mL p = 0.0437. IL-6 release: (C) Control vs. LPS 1 µg/mL p = 0.0001, DMSO vs. ME 100 µg/mL p = 0.0166; (D) Control vs. LPS 1 µg/mL p < 0.0001, DMSO VS. PC 100 µg/mL p = 0.0173. PGE2 release: (E) Control vs. LPS 1 µg/mL p = 0.0024, DMSO vs. ME 10 µg/mL p = 0.0498, DMSO vs. ME 100 µg/mL p = 0.0361; (F) Control vs. LPS 1 µg/mL p = 0.0076, DMSO vs. PC 100 µg/mL p = 0.0745. LTB4 release: (G) Control vs. LPS 1 µg/mL p < 0.0001, DMSO vs. ME 10 µg/mL p = 0.0166, DMSO vs. ME 100 µg/mL p = 0.0091; (H) Control vs. LPS 1 µg/mL = 0.0001, DMSO vs. PC 1 µg/mL p = 0.0151, DMSO vs. PC 10 µg/mL p = 0.0412, DMSO vs. PC 100 µg/mL p = 0.0293. Two-way ANOVA analyzed each quantified result with a Tukey’s post hoc test. **p < 0.01, ***p < 0.001; +p < 0.05, ++p < 0.01.

