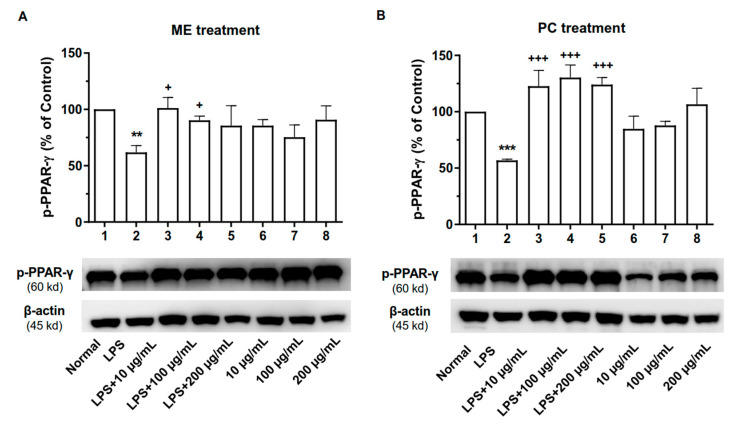
Figure 8.
Effect of ME and PC on p-PPAR-γ protein in RAW 264.7 cells. The expression level of p-PPAR-γ protein was measured after ME (A) or PC (B) treatment in RAW 264.7 cells. 1—Normal group, 2—LPS-treated control group, 3—LPS-treated control group + 10 µg/mL ME or PC, 4—LPS-treated control group + 100 µg/mL ME or PC, 5—LPS-treated control group + 200 µg/mL ME or PC, 6—Normal group + 10 µg/mL ME or PC, 7—Normal group + 100 µg/mL ME or PC, 8—Normal group + 200 µg/mL ME or PC. β-Actin was used as an internal control. Values are mean ± SEM (n = 3). These values are expressed as the percentage of the control tested protein/β-actin for each sample. ME-treatment (B): 1 vs. 2 p = 0.0091, 2 vs. 3 p = 0.0296, 2 vs. 4 p = 0.0457; PC-treatment (C): 1 vs. 2 p = 0.0009, 2 vs. 3 p = 0.0008, 2 vs. 4 p = 0.0002, 2 vs. 5 p = 0.0004. (one-way ANOVA for multiple comparisons, **p < 0.01, ***p < 0.001; +p < 0.05, +++p < 0.001).

