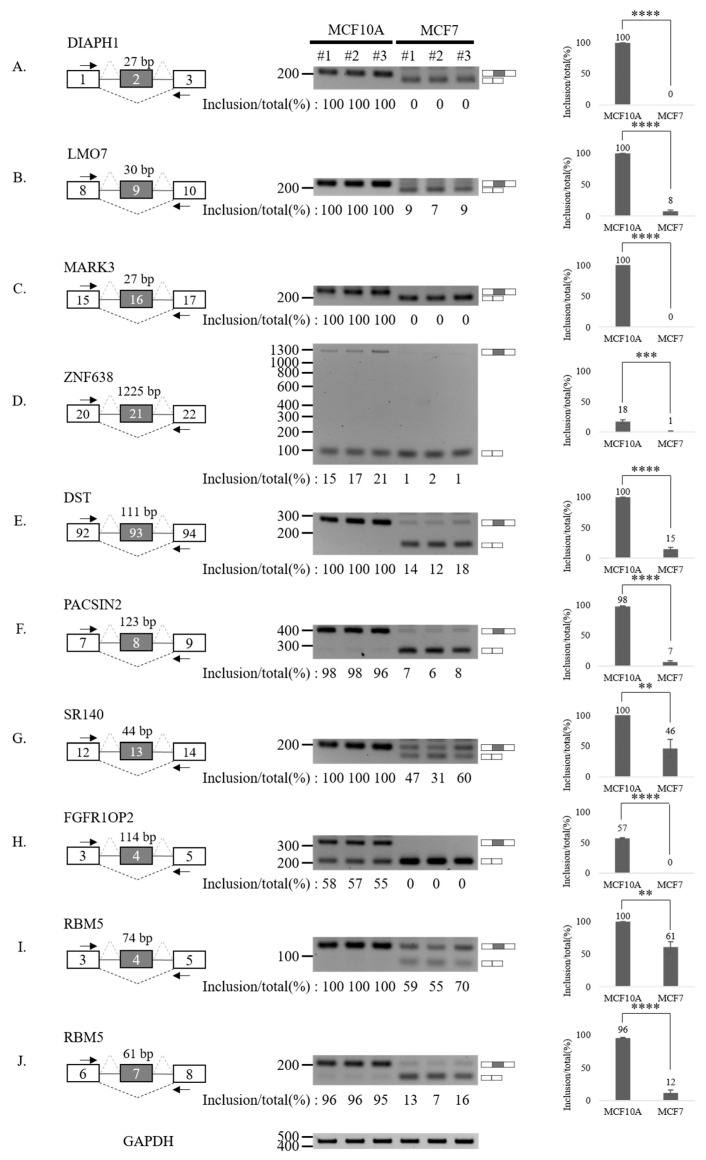
Figure 4.
Validation of AS down-regulated cassette exons in human breast cancer cells. (A–J) (Left) For each gene, the schematic representation of the genomic region containing the AS cassette exon is shown. Exon numbers are shown in the gray boxes. The length of AS cassette exons is shown above the exon. Inclusions of cassette exons are shown with dotted grey lines. Skipping events are shown with dotted black lines. Arrows indicate primers used in RT-PCR. (Middle) RT-PCR analysis (in triplicated) of the AS profile of cassette exons was performed by using RNA extracted from human breast cells. Quantitation results are shown at the bottom of each gel. (Right) Statistical analysis graphs of RT-PCR. Error bars = standard deviation (SD) calculated from three independent experiments. **** p < 0.0001, *** p < 0.001, ** p < 0.01. Uncropped figures are shown in Supplementary Figure S8.

