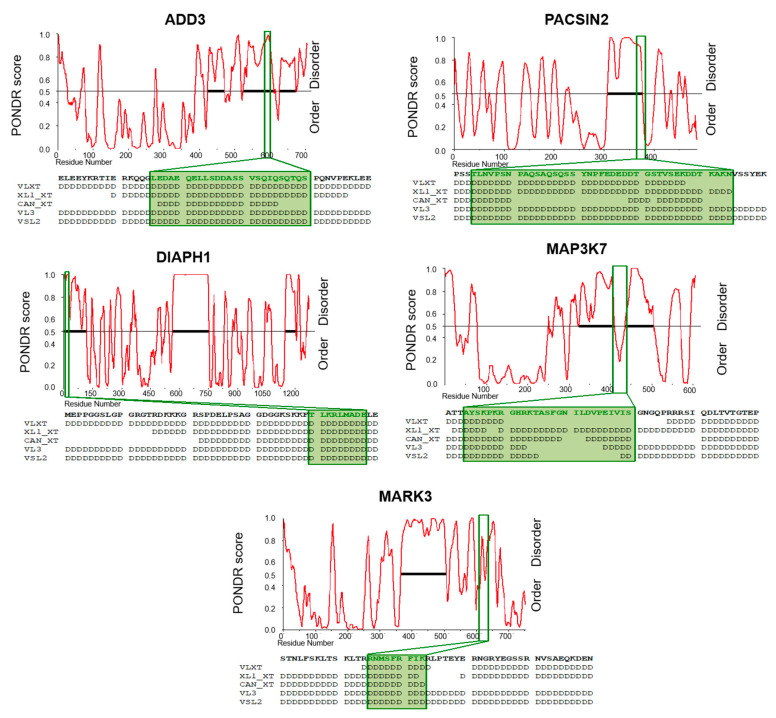
Figure 6.
Prediction of intrinsically disordered regions (IDRs) in the validated aberrantly expressed exons in breast tumors. IDRs were predicted by using the PONDR web tool. Graphical representation, using only the VL-XT algorithm, of ADD3, PACSIN2, DIAPH1, MARK3, and MAP3K7 PONDR Scores for each residue. The disorder threshold (0.5) is shown as the black line. Positions of aberrantly expressed AS exons are indicated by green boxes. Below each representation, the amino acid sequence of each AS exon is reported in bold. Adjacent residues are also shown. The disordered residues predicted by different algorithms (VLXT, XL1_XT, CAN_XT, VL3 and VSL2) are indicated with “D”.

