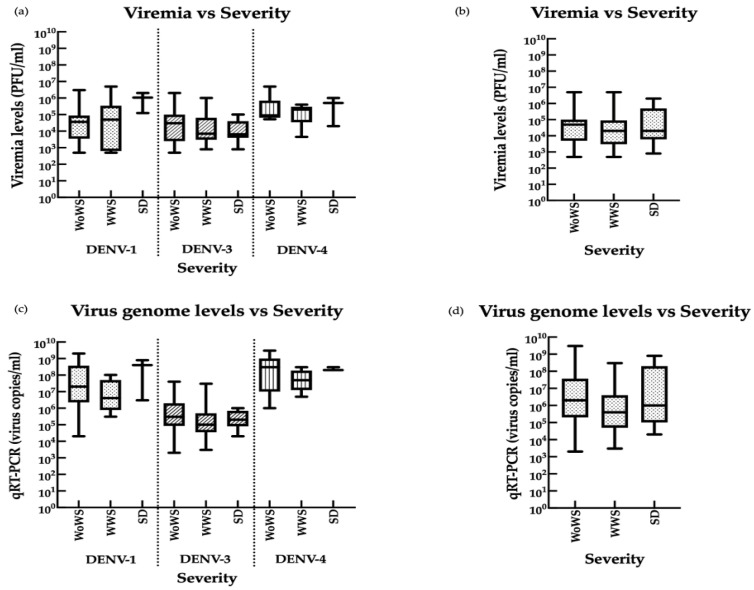
Figure 7.
Comparison of viremia and disease severity in patients infected with DENV-1, DENV-3, and DENV-4. (a–d) Serum DENV-1 (n = 31), DENV-3 (n = 76), and DENV-4 (n = 15) levels determined by (a,b) plaque assay and (c,d) qRT-PCR. Data are presented for each serotype individually (a,c) or in combination (b,d). WoWS, without warning signs; WWS, with warning signs; SD, severe dengue (WHO classification). Boxplots show the median values (horizontal line in the box), 25–75% interquartile range (lower–upper limits of the box).

