Figure 2.
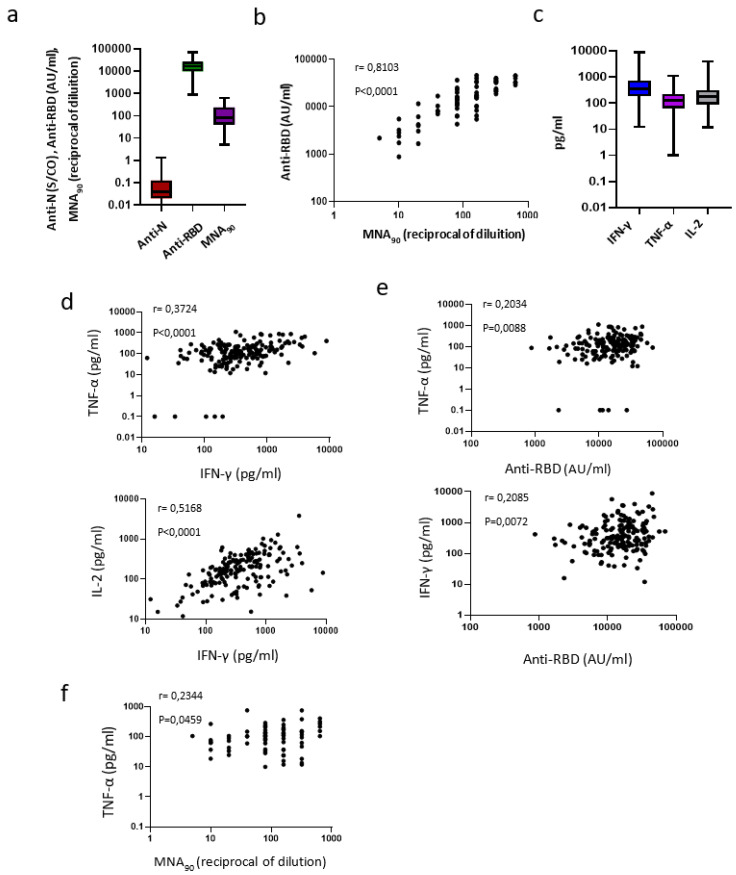
Coordinated immune response to vaccination. Legend to Figure 2: Cross-sectional study (a–f). (a) SARS-CoV-2 specific anti-N and anti-RBD Abs were analyzed at T2 in 169 HCWs; a microneutralization assay (MNA90) was also performed in a subgroup of the enrolled HVWs (n = 73). Results are shown as box and whiskers graphs. (b) The correlation between the anti-RBD antibody titer and MNA90 is shown (n = 73); (c) Cytokines (IFN-γ, TNF-α, IL-2) were quantified in stimulated blood samples at T2 (n = 169); (d) The correlation between the levels of IFN-γ and TNF-α and between IFN-γ and IL-2 are shown (n = 169). Each black dot represents one sample (e) The correlations between the level of IFN-γ and anti-RBD antibody titers and between the level of TNF-α and anti-RBD antibody titers are shown (n = 169). Each black dot represents one sample (f) The correlation between TNF-α and MNA90 is shown (n = 73). Each black dot represents one sample.

