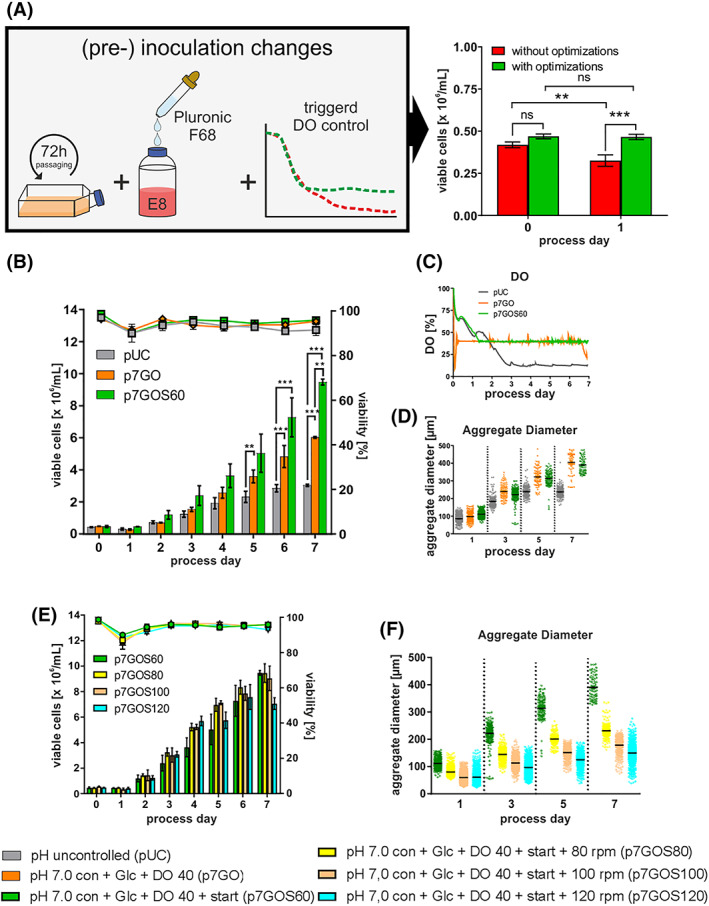
FIGURE 2.

Impact of optimized single cell inoculation on process performance. A, Schematic outline of changes performed that resulted in the increased cell densities (green bars; n = 11) and control conditions (red bars; n = 15). B, Viable cell densities (bar chart) and viability (line graphs) for processes using the cell line hHSC_F1285T_iPS2. Processes conditions: pH uncontrolled (pUC; gray) or controlled at pH 7.0 with additional Glc supplementation from day 3 onwards and additional DO control (p7GO; orange) or optimized inoculation (p7GOS60; green). All processes were performed using a MPR of D = 1/d. C, Online process parameter measurement of dissolved oxygen (DO). D, Distribution of aggregate diameters over the cultivation time. Impact of stirring rates on process performance and aggregate size. E, Viable cell densities (bar chart) and viability (line graphs) for perfusion processes using the cell line hHSC_F1285T_iPS2. Processes conditions: controlled at pH 7.0, Glc supplementation, DO 40% control and optimized inoculation at 60 rpm (gray; n = 2), 80 rpm (red; n = 5), 100 rpm (blue; n = 3) and 120 rpm (green; n = 3). All processes were performed using a MPR of D = 1/d. F, Distribution of aggregate diameters over the cultivation time. All Data displayed in this figure was generated with the cell line hHSC_1285_iPS2. Results are presented as mean ± SEM. Differences were considered statistically significant at *P < .05, **P < .01, and ***P < .001
