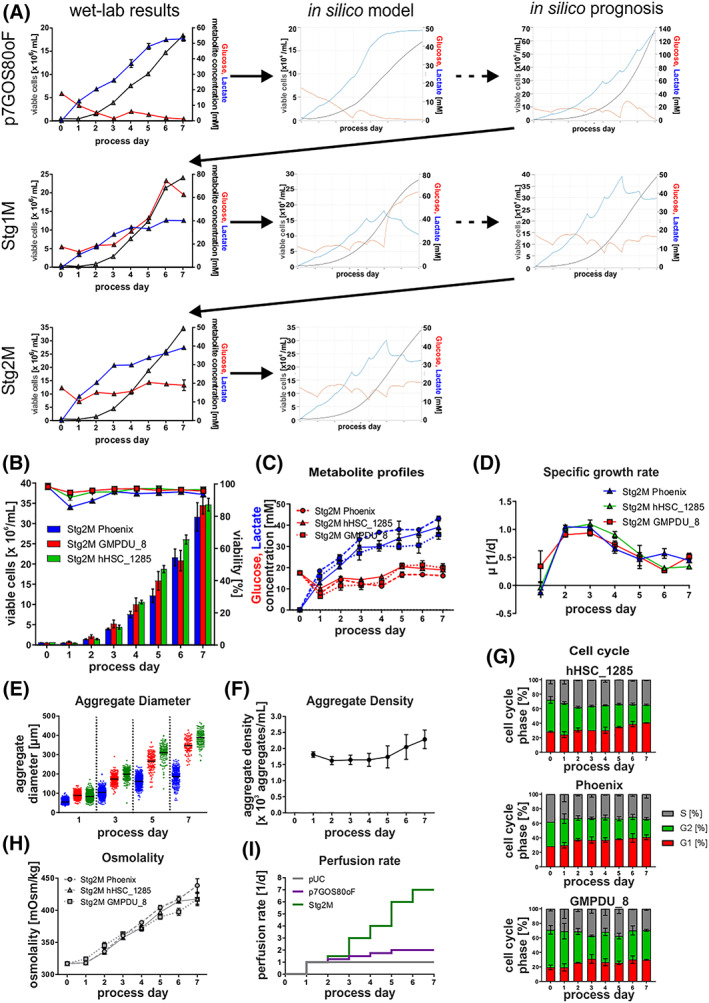
FIGURE 4.

Model‐based in silico process optimization. A, Outline of the iterative model building process, including in silico results of each optimization step. B, Viable cell densities (bar chart) and viability (line graphs) for processes using the cell lines Phoenix (blue; n = 3), hHSC_F1285T_iPS2 (green, n = 3), and GMPDU_8 (red, n = 2). Process strategy followed the results of the stage 2 model. C, Respective process‐dependent patterns of glucose (red) and lactate (blue) concentrations in cell culture supernatants using the cell lines Phoenix (dashed lines), hHSC_F1285T_iPS2 (solid lines), and GMPDU_8 (dotted lines). D, Based on viable cell densities calculated values for the specific growth rate μ. E, Distribution of aggregate diameters over the cultivation time. F, Aggregate density of GMPDU_8 during the cultivation. G, Cell cycle analysis of cultures of the cell lines hHSC_1285T_iPS2 (n = 3), Phoenix (n = 3) and GMPDU_8 (n = 2) cultured under Stg2M conditions. H, Respective process‐dependent patterns of osmolality in cell culture supernatants using the cell lines Phoenix (dashed lines), hHSC_F1285T_iPS2 (solid lines), and GMPDU_8 (dotted lines). I, Perfusion rate applied for the respective processes. All Data displayed in this figure was generated with the three cell lines hHSC_1285_iPS2, Phoenix, and GMPDU_8
