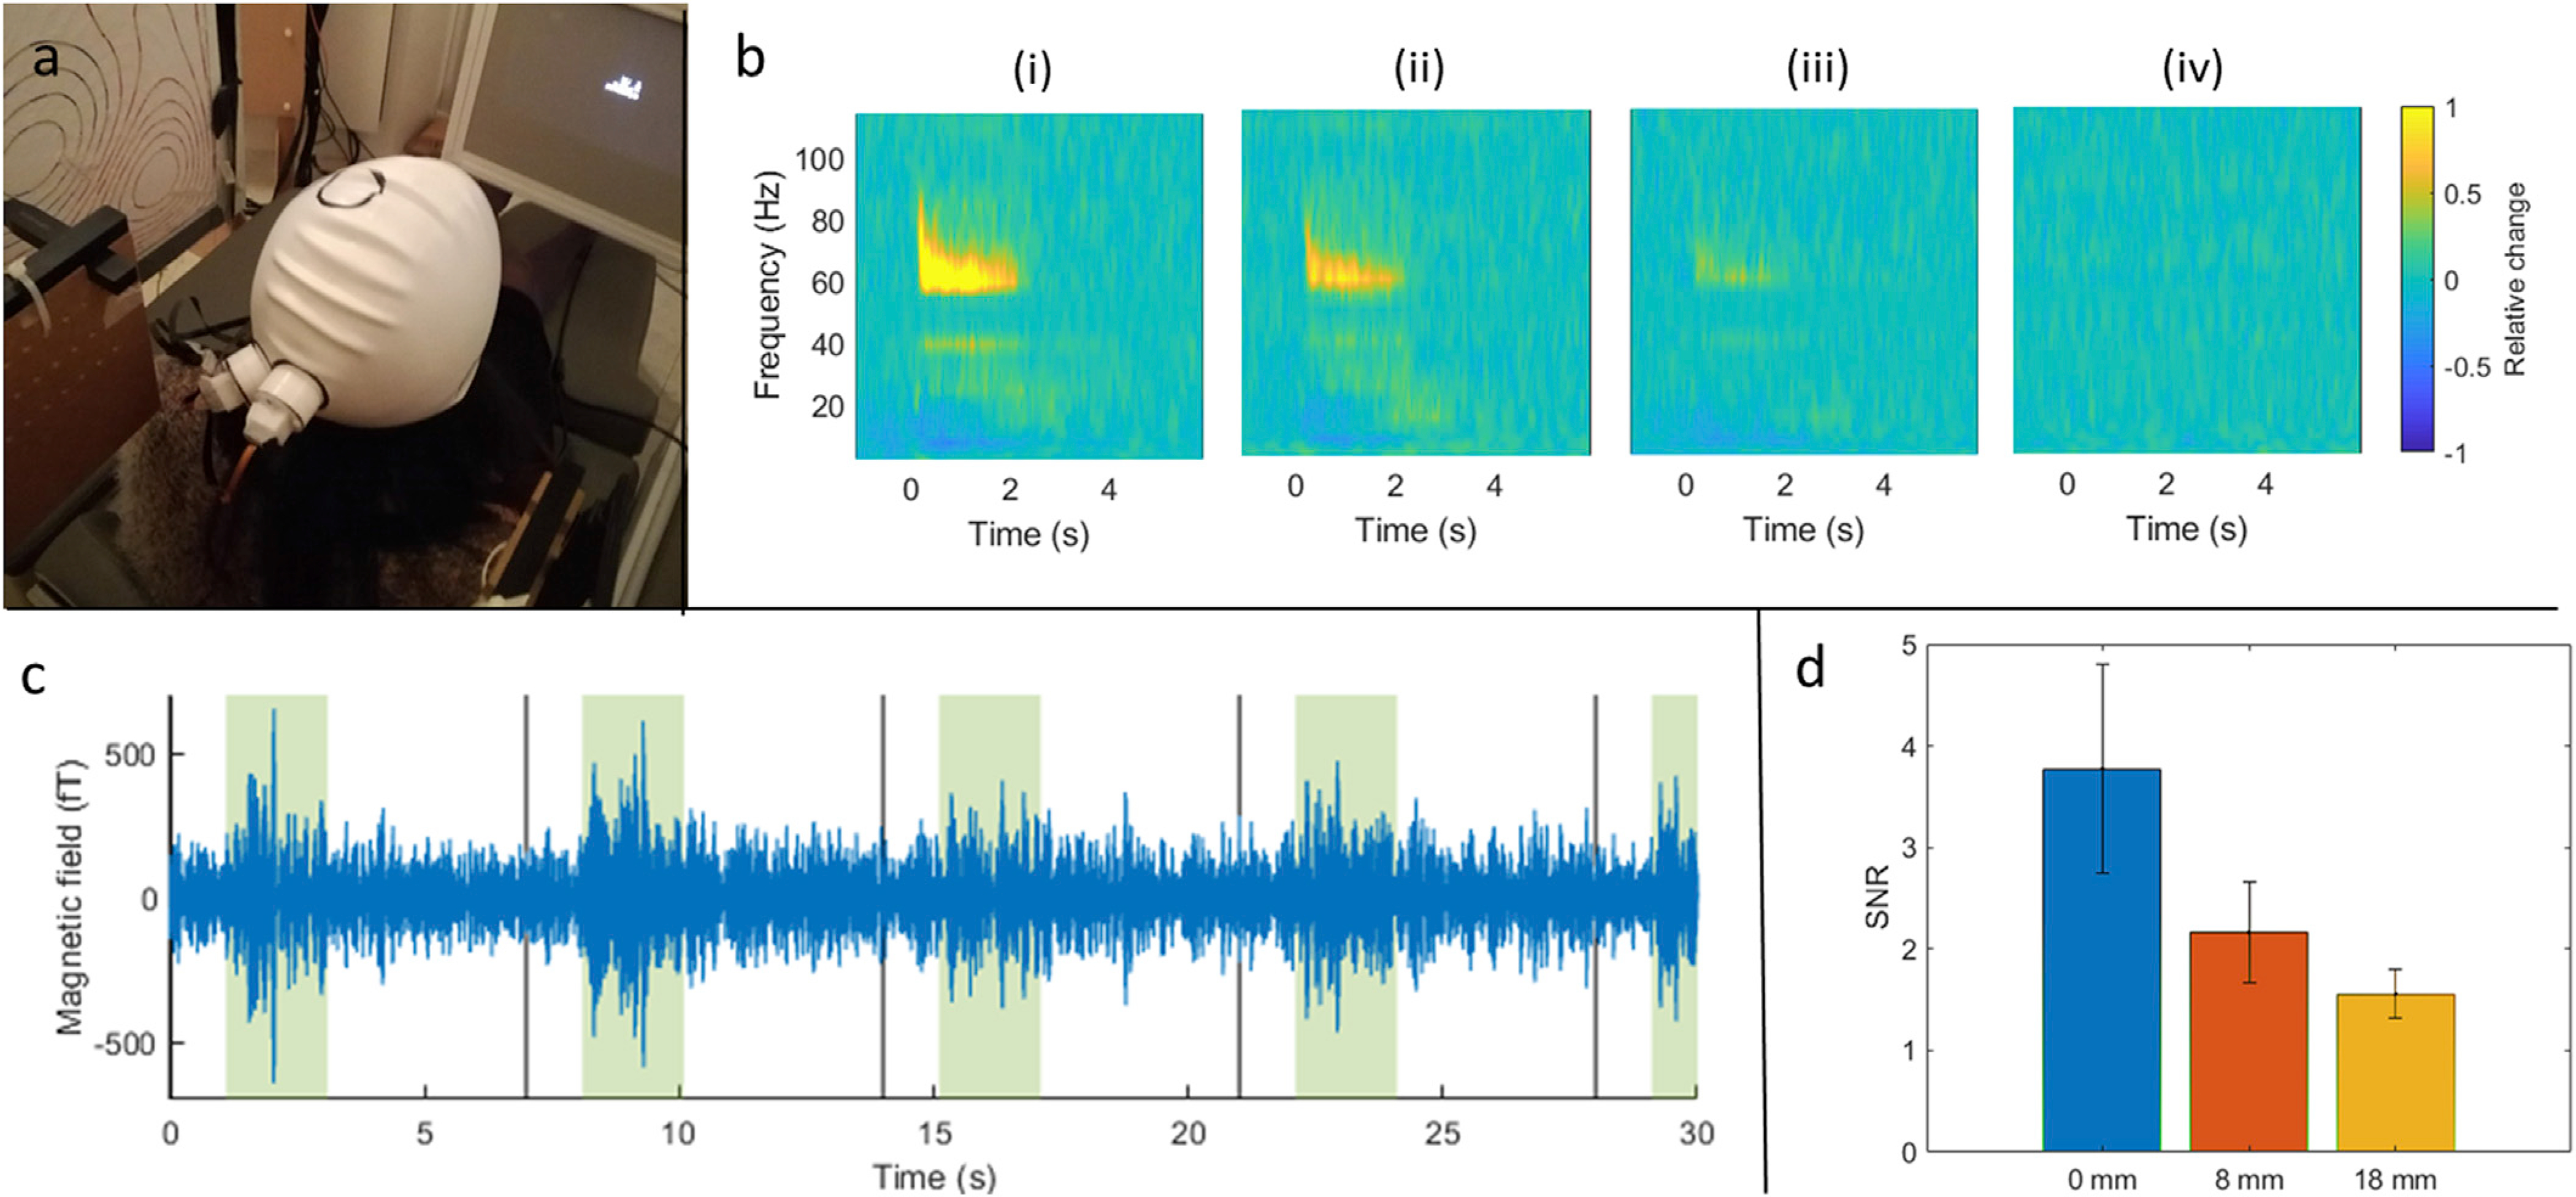
Fig. 3. Gamma-band responses in primary visual cortex.

a) Experimental set-up. b) TFSs showing gamma modulation with the sensor mounted at distances of 0 mm (i), 8 mm (ii), 18 mm (iii) from the head. Note also, that a stimulus induced drop in alpha (8–13 Hz) band amplitude during stimulation is apparent. (iv) shows a phantom recording for comparison. c) Representative single-trial gamma responses with periods of visual stimulation (stimulation windows highlighted in shaded green). d) Quantification of the (single-trial) SNR during stimulation for each sensor distance.
