
Fig. 4. Simultaneous EEG/MEG - Task.
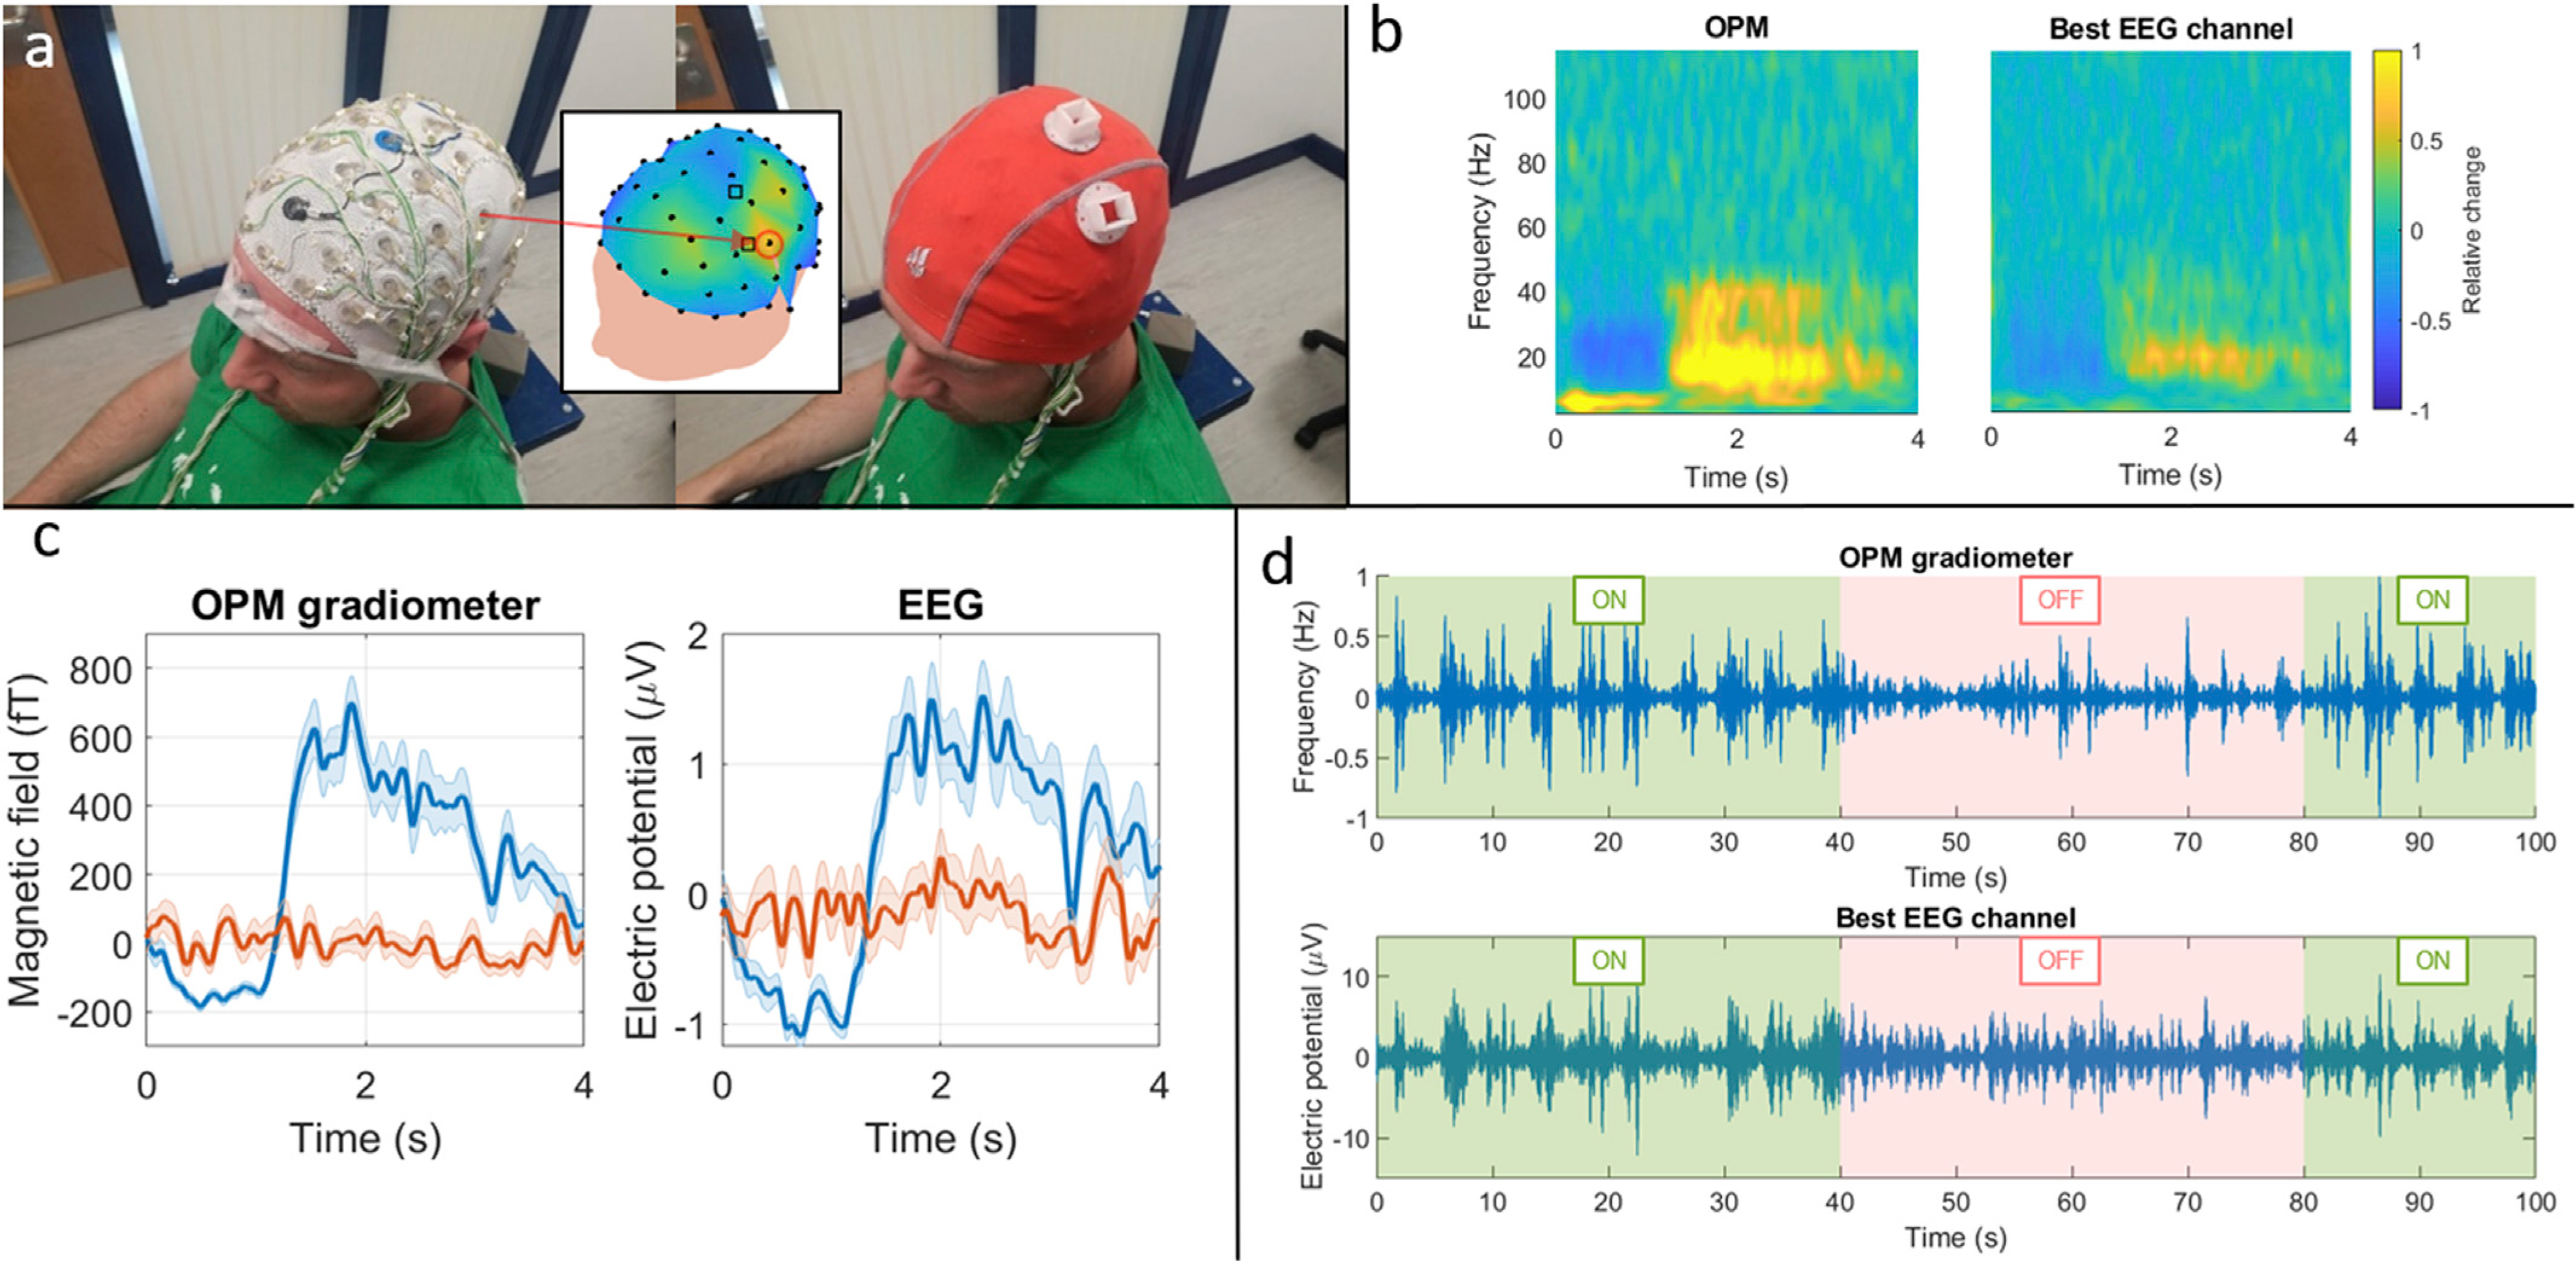
a) Experimental set-up showing photographs of the EEG cap, mounted on the subject’s head and overlaid with a second flexible cap housing the OPMs. The central plot shows the EEG (black dots) and OPM channels (black squares) on the subject’s head, and the EEG channel (C3) that showed the highest beta-band response is circled in red. b) TFSs showing responses in OPM-MEG and EEG. c) Line plots showing the baseline-corrected beta-band oscillatory amplitude, averaged across task trials (blue) and rest trials (red). d) Single-trial responses in the 13–20 Hz band, for OPM (top) and EEG (bottom).