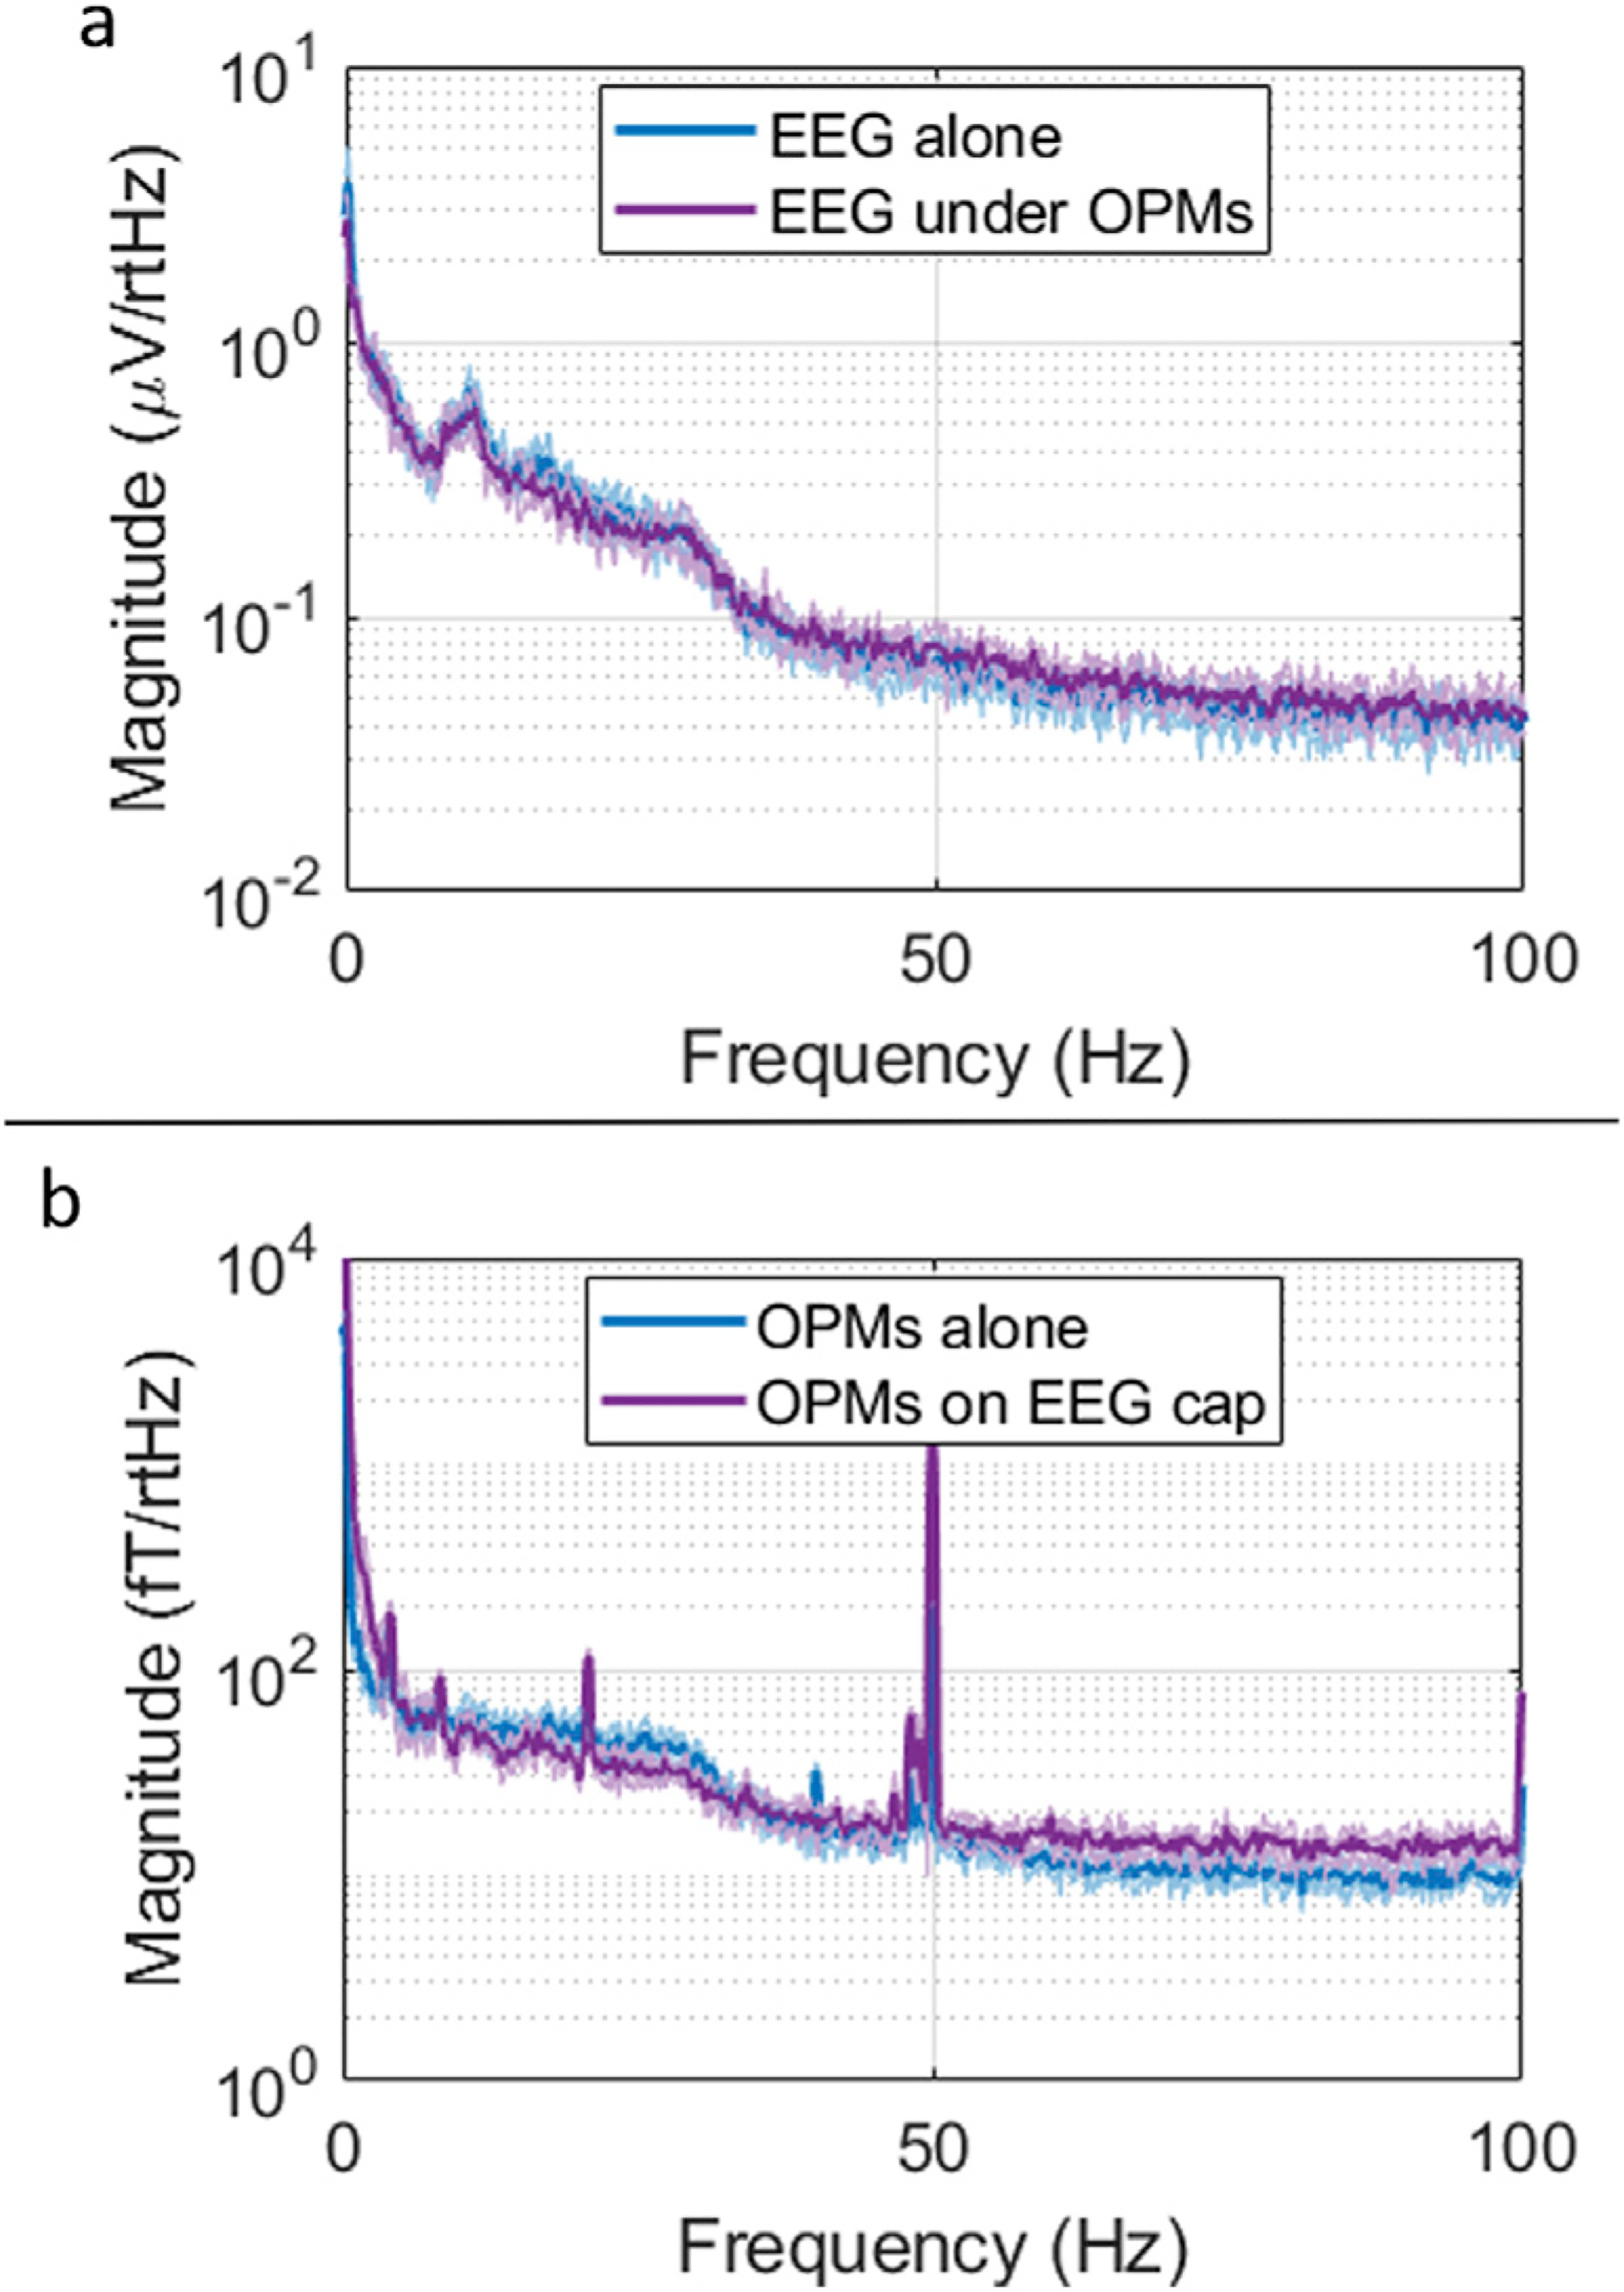
Fig. 5. Simultaneous EEG/MEG – Resting state.

a) Power spectral density of resting state EEG signal when collected alone (blue) and concurrently with the OPMs (purple). b) Equivalent PSD for the OPM planar gradiometer when collected without (blue) and with (purple) the EEG cap. (For magnetometer results see Supplementary Material).
