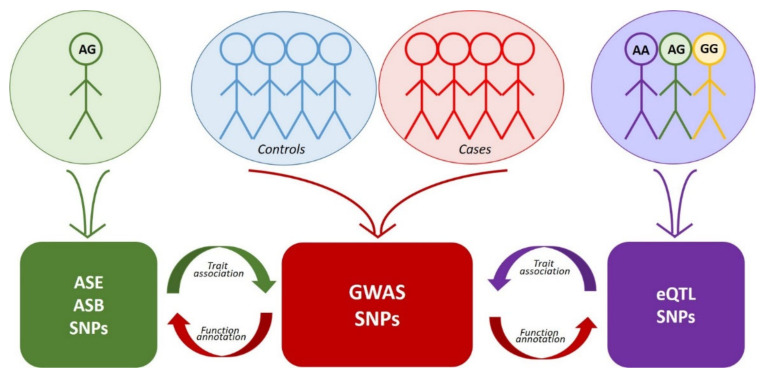
Figure 1.
Interplay between the approaches to the search for functional SNPs. Colored blocks denote arrays of corresponding data. Red arrows indicate functional annotation of GWAS data using eQTL, ASE or ASB analysis. Purple arrow indicates the search for association of eQTL SNPs with traits via comparison with GWAS data. Green arrow—the same for SNPs detected by ASE or ASB analysis.

