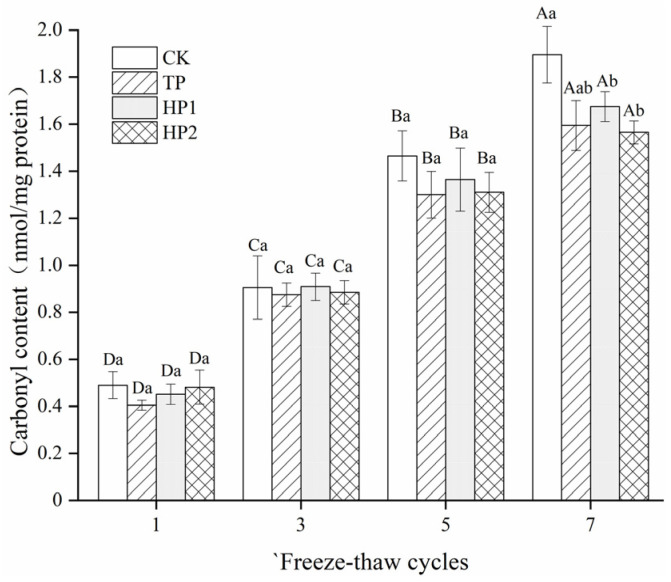
Figure 4.
Changes in carbonyls’ contents in freeze-thawed fish fillets: CK: fillets in distilled water; TP: fillets in tea polyphenol; HP1: fillets in 1% bone hydrolysates; HP2: fillets in 2% bone hydrolysates. Different capital letters indicate the results that differ significantly in freeze–thaw cycles with the same treatment (p < 0.05). Different lowercase letters indicate the results that differ significantly with different treatments in the same freeze–thaw cycle (p < 0.05).

