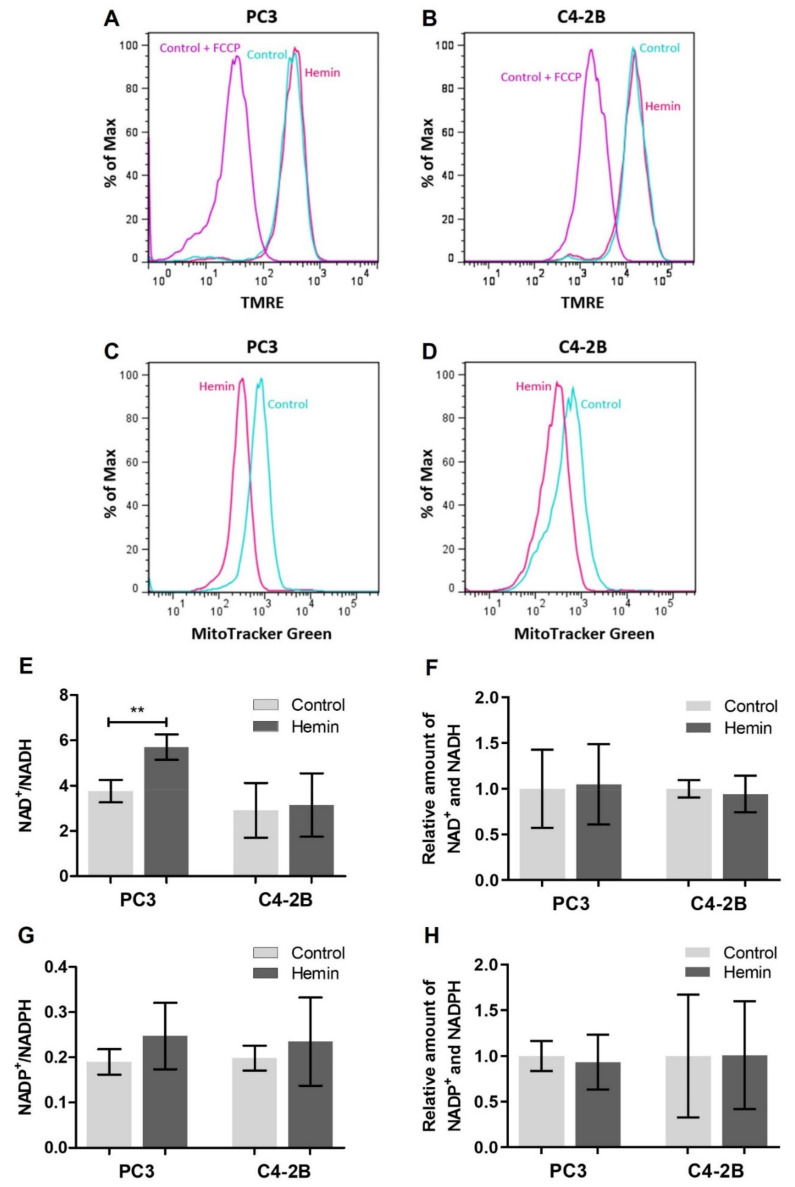
Figure 3.
Mitochondrial status and redox balance in PCa cell lines under HO-1 induction. (A) PC3 and (B) C4-2B mitochondrial integrity evaluated after hemin treatment by flow cytometry using the potential-sensitive dye TMRE. Pre-treatment of control cells with the potent uncoupler of mitochondrial oxidative phosphorylation, FCCP (carbonyl cyanide 4-(trifluoromethoxy)phenylhydrazone), was used to determine the baseline. One representative of three independent experiments is shown. (C) PC3 and (D) C4-2B total mitochondrial mass was assessed after hemin treatment by flow cytometry using MitoTracker Green. One representative of three independent experiments is shown. (E) NAD+/NADH ratio and (F) total amount of NAD+ and NADH (normalized to the control) were determined using the NAD/NADH-Glo Assay (Promega, USA). Data are presented as mean ± SD of three independent experiments, each performed in triplicate. (G) NADP+/NADPH ratio and (H) total amount of NADP+ and NADPH (normalized to the control) were measured with the NADP/NADPH-Glo Assay (Promega, USA). Results are shown as mean ± SD of three independent experiments, each performed in triplicate. Significant differences: ** p < 0.01.

