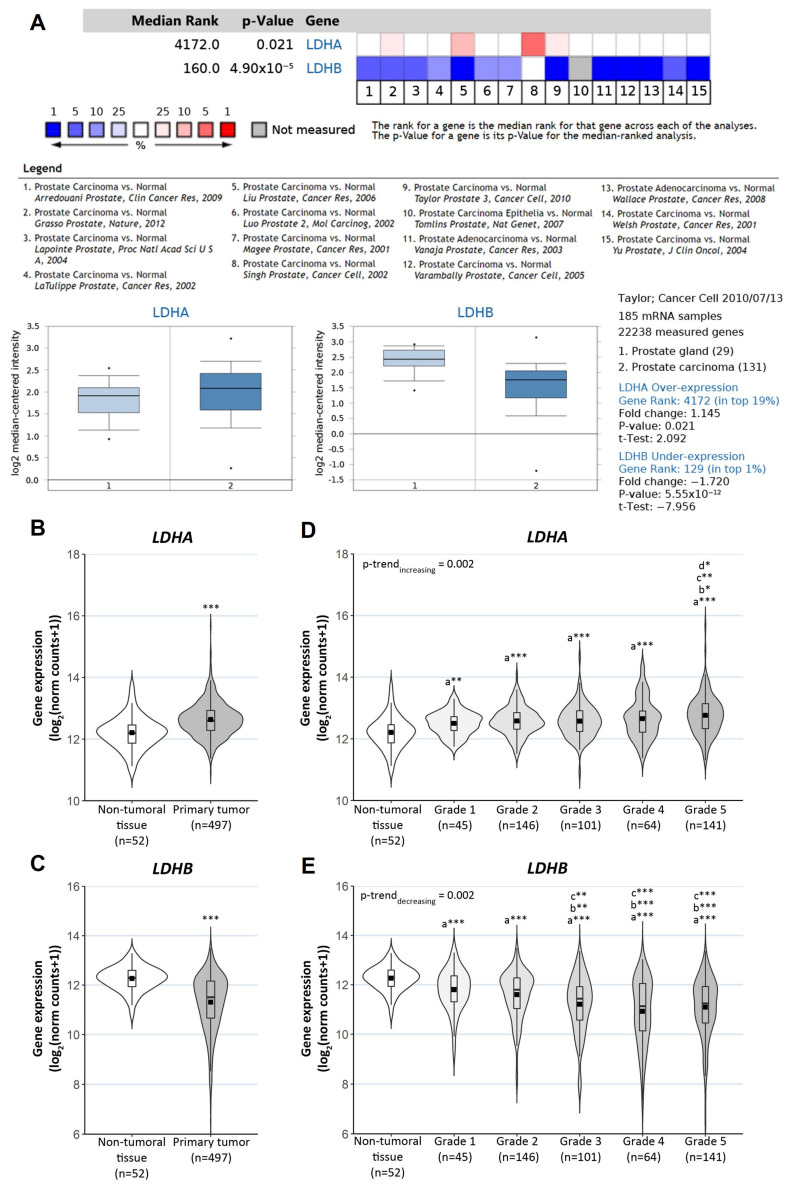
Figure 5.
Clinical relevance of LDHA and LDHB expression in PCa. (A) Meta-analysis of microarray datasets on the public cancer database Oncomine for LDHA and LDHB expression (n = 973 patient samples). One representative box plot is shown for each gene comparing its expression profile between group 1: Prostate Gland and group 2: Prostate Adenocarcinoma. Analysis of differential gene expression using RNAseq data from TCGA-PRAD: (B) LDHA and (C) LDHB mRNA levels in primary tumor samples (n = 497) and non-tumoral adjacent tissue samples (n = 52). (D) LDHA and (E) LDHB expression levels in PCa samples categorized according to the ISUP grading system. Significant differences: * p < 0.05; ** p < 0.01; *** p < 0.001; the letter represents which group sample was considered as a reference: a = non-tumoral tissue, b = grade 1, c = grade 2 and d = grade 3; p-trend values correspond to Jonckheere-Terpstra trend test.

