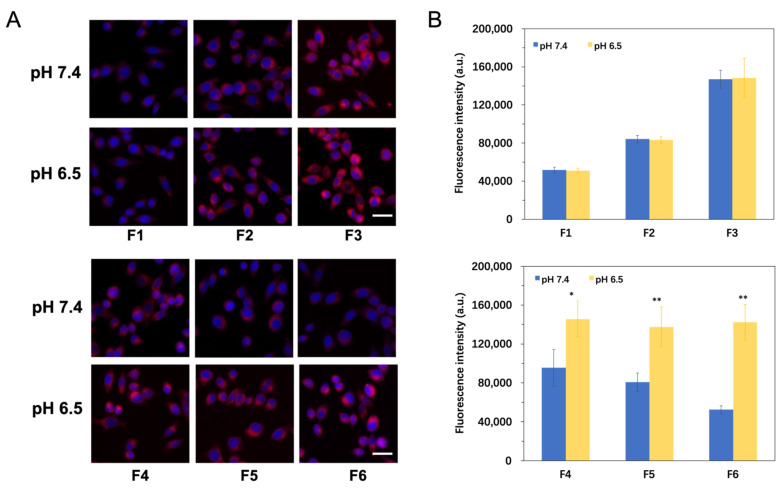
Figure 5.
In vitro cellular uptake studies of Cy5.5-labeled nanoparticles with different concentrations of TAT and PGlu-PEG in Hep G2 cells for 4 h. (A) Representative images depicting cellular uptake of different formulations with various concentrations of TAT and PGlu-PEG coating (F1–F6) at pH 7.4 and pH 6.5; Blue: DAPI for nuclei, Red: Cy5.5. Scale bar represents 20 μm. (B) Quantitative analysis of the fluorescence signals of Cy5.5 at pH 7.4 and pH 6.5 (n = 3). * p < 0.05; ** p < 0.01. F1 represents N-NPs (without TAT or PGlu-PEG modifications); F2 and F3 represent TAT-NPs modified with different TAT concentrations (0.6% for F2 and 1.2% for F3) but without PGlu-PEG modification; F4, F5, and F6 represent PGlu-PEG/TAT-NPs thta were modified with the same TAT concentration (1.2%) but different PGlu-PEG concentrations (2% for F4, 5% for F5, and 10% for F6).

