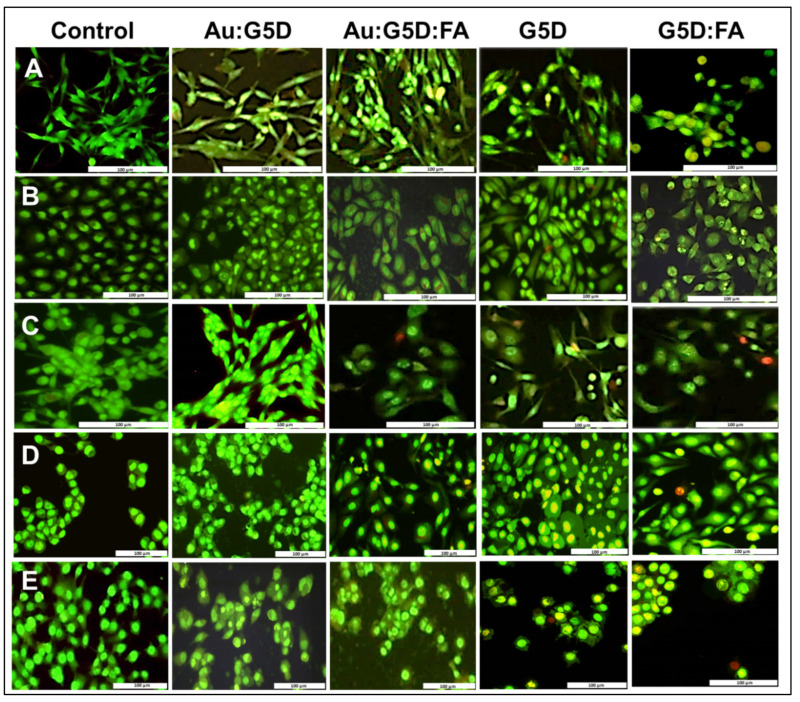
Figure 8.
Fluorescence images of (A) HEK293, (B) HepG2, (C) Caco-2, (D) MCF-7, and (E) KB cells treated with test and control nanocomplexes prepared at sub-optimum ratios for 24 h, showing induction of apoptosis. Green = live (L), light orange = early apoptotic (EA), and dark orange = late apoptotic (LA) cells. Scale = 100 μm.

