. 2021 Jun 11;9(6):e24116. doi: 10.2196/24116
©Meina Lv, Tingting Wu, Shaojun Jiang, Wenjun Chen, Jinhua Zhang. Originally published in JMIR mHealth and uHealth (https://mhealth.jmir.org), 11.06.2021.
This is an open-access article distributed under the terms of the Creative Commons Attribution License (https://creativecommons.org/licenses/by/4.0/), which permits unrestricted use, distribution, and reproduction in any medium, provided the original work, first published in JMIR mHealth and uHealth, is properly cited. The complete bibliographic information, a link to the original publication on https://mhealth.jmir.org/, as well as this copyright and license information must be included.
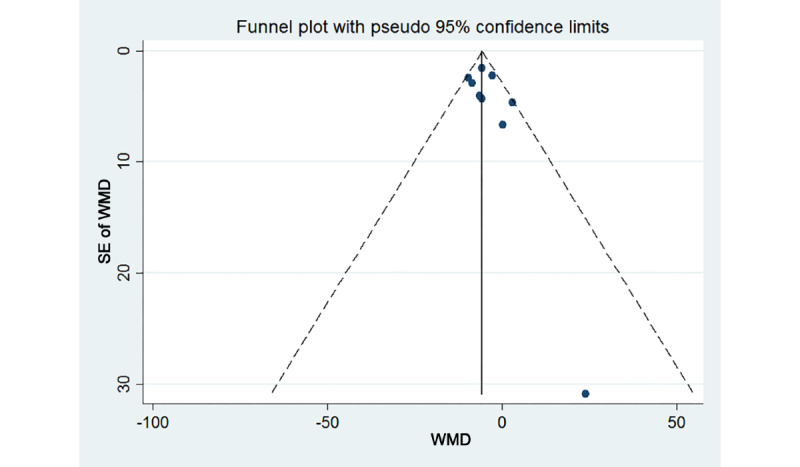
Figure 6.

Funnel plot of the systolic blood pressures. WMD: weighted mean difference.
