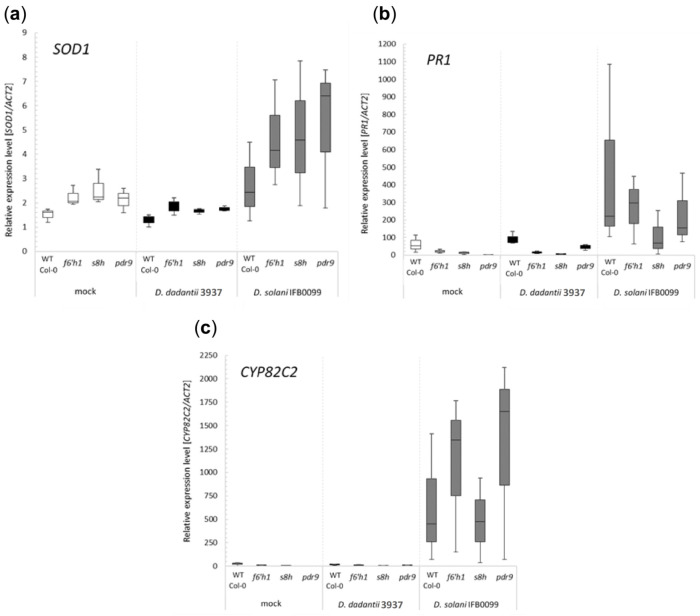
Figure 6.
Relative expression levels of plant stress marker genes (a) SOD1 (AT1G08830), (b) PR1 (At2g14610) and (c) CYP82C2 (At4g31970) analysed in the leaves of Arabidopsis thaliana wild-type (WT) Col-0 and mutant plants (f6′h1, s8h, pdr9) grown in soil mix #1 and inoculated with Dickeya dadantii 3937 and Dickeya solani IFB0099. 0.85% NaCl treated plants were used as a negative control. As a reference, the ACT2 (At3g18780) gene was used [44]. Error bars, ±SD, from three biological replicates.

