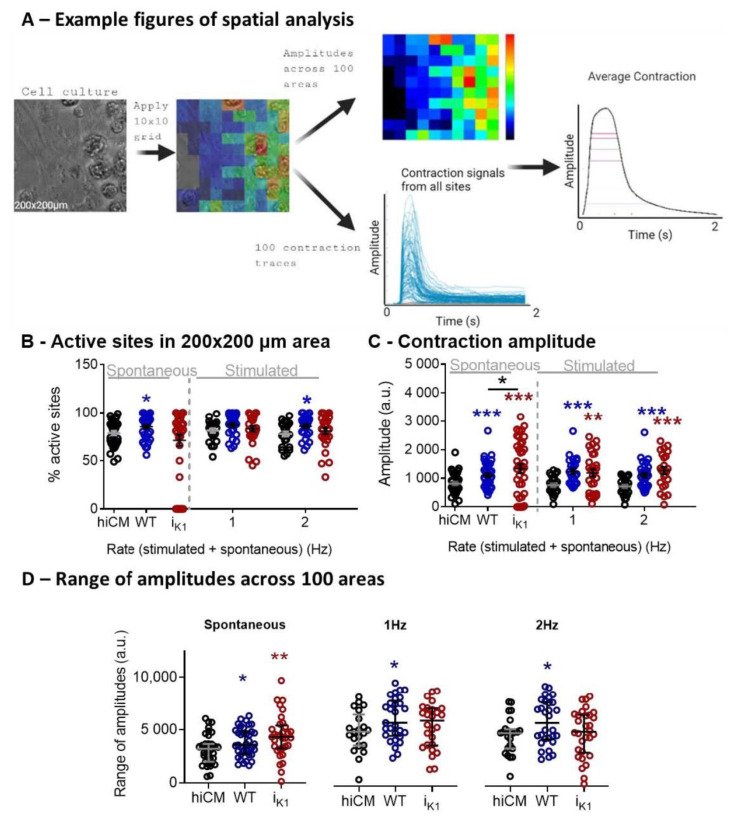
Figure 3.
Spatial analysis of 1:1 HEK:CM on day 4 in culture in serum-free medium. (A) Example images obtained using spatial analysis of contractile motion. A heat map showing amplitudes recorded in a 200 × 200 µm area using a 10 × 10 grid were derived from the brightfield image (left). The colors represent the amplitude of the contraction in each square. Contraction signals from all sites and the average contraction are also shown. (B) Percentage of active sites representing contractile cells in a 200 × 200 µm area. (C) The amplitude of the contraction determined by pixel displacement. (D) Mean of range of amplitudes across a 10 × 10 grid. Unpaired t-test: HEK-IK1 vs. HEK–WT (black) and hiCM vs. HEK–WT (blue) or HEK-IK1 (red). *** p < 0.001, ** p < 0.01, * p < 0.05, n > 28 cells, 5 platings.

