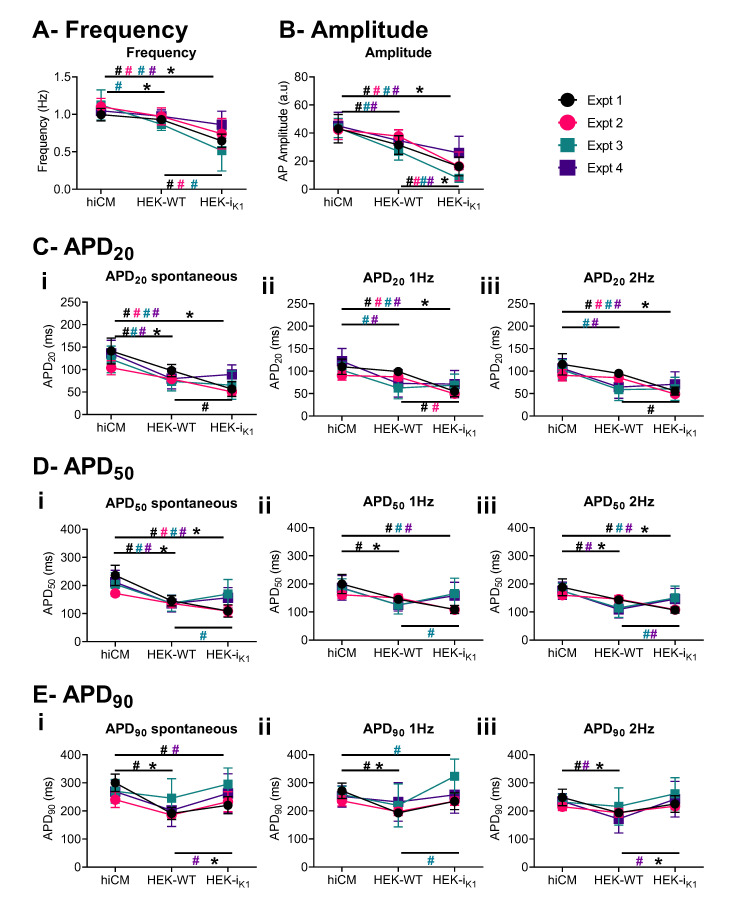
Figure 4.
Electrophysiological effects of 1:1 co-culture on day 4 in vitro in serum-free conditions, showing the observations from individual experiments. Each plating is shown in a different color, and data are presented as mean+/−SD. (A) Frequency of spontaneous beating. (B) Amplitude of the AP. (C) APD20 at (Ci) spontaneous, (Cii) 1Hz, and (Ciii) 2Hz. (D) APD50 at (Di) spontaneous, (Dii) 1 Hz, and (Diii) 2 Hz. (E) APD90 at (Ei) spontaneous, (Eii) 1 Hz, and (Eiii) 2 Hz. Due to the small AP amplitude and low signal-to-noise ratio (SNR) (Supplementary Figure S3) in HEK-IK1:hiCM, fewer data are available for APD90 at spontaneous rates. Comparison of each culture (hiCM, HEK–WT:hiCM and HEK-IK1:hiCM) within each experiment is shown as # in the respective experimental color, and 2-way ANOVA was used for statistical analysis. The mean of all experiments was then compared using a paired t-test and this is shown with * (p < 0.05).

