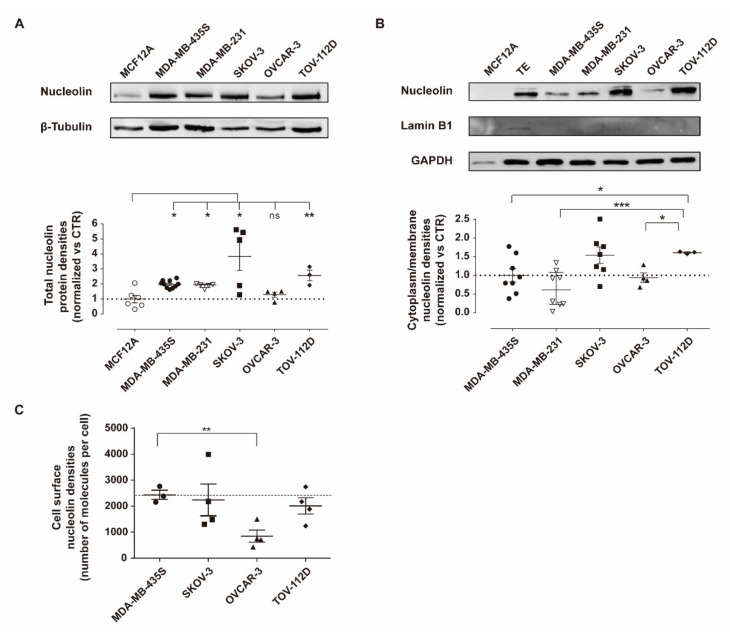
Figure 1.
Nucleolin expression density in ovarian cancer cell lines. Quantification of nucleolin protein densities in (A) total extracts and (B) cytoplasm/membrane extracts was performed by immunoblotting in ovarian cancer cell lines SKOV-3, OVCAR-3 and TOV-112D, as well as triple-negative breast cancer MDA-MB-231, nucleolin-overexpressing MDA-MB-435S and non-tumorigenic MCF12A cells, used as controls. (C) Cell surface nucleolin density was quantified by flow cytometry in the indicated cell lines. Data represent mean ± SEM (n = 3 unpaired t test with Welch’s correction; ns p > 0.05, * p < 0.05, ** p < 0.01 *** p < 0.001). TE = total extract; control (CTR) = β-tubulin or GAPDH. Whole Western Blots images can be found in Figure S5.

