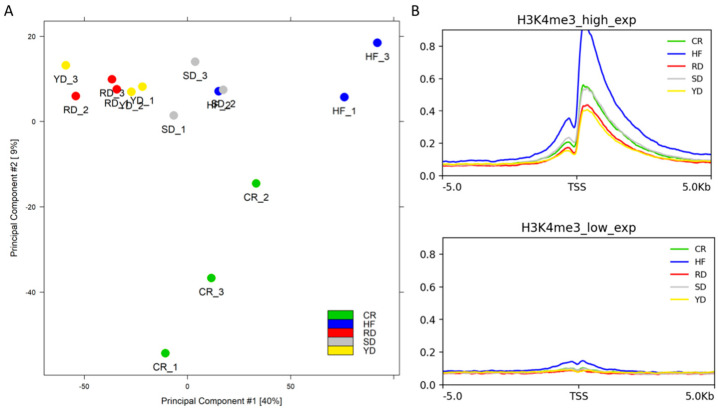
Figure 3.
Heterogeneity of samples and average signal on the TSSs of the different diets: (A) PCA of all the samples analyzed, labelled by different colours following to the different dietary groups as indicated. (B) Average signal level found on the TSSs of 1000 high-expressed genes (upper panel) and 1000 low-expressed genes (lower panel).

