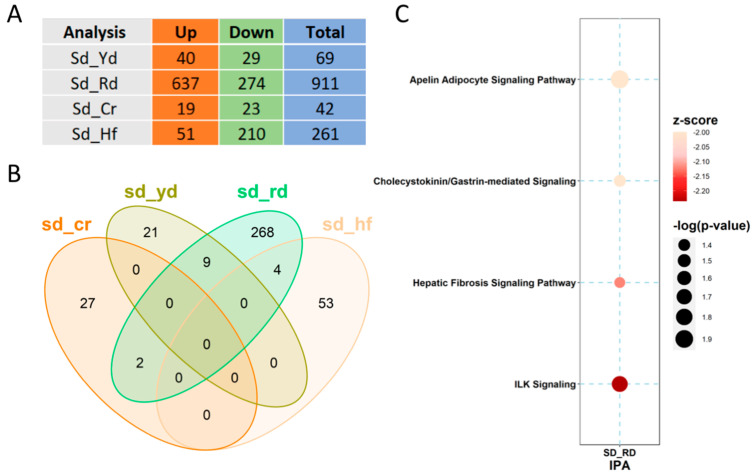
Figure 4.
Comparisons of the H3K4me3 signals genome-wide and on promoters: (A) Comparison of the number of different peaks identified genome-wide by diet, as indicated. (B) Venn diagram of the promoter regions differentially marked with H3K4me3 by the different diets with respect to the SD. (C) IPA-identified pathways for the genes whose promoters are differentially marked by the RD.

