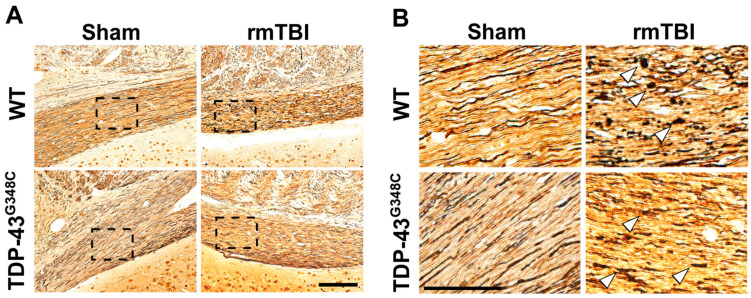
Figure 2.
Axonal degeneration in the optic tract (OT) of wild-type (WT) and TDP-43G348C mice at 6 months after repetitive mild traumatic brain injury (rmTBI). (A) Representative microphotographs of the OT stained with the silver staining in the mice of the control group (Sham) and the animals with rmTBI. Scale bar: 200 μm. (B) Microphotographs are higher-magnification images of the areas in the boxes of the corresponding panels. Arrowheads point to the spheroids of degenerating axons. Scale bar: 50 μm.

